Funding Ratios for City Government Multi-Employer Plans Don’t Get the Attention that Goes to Single Employer Plans
Breakdown by Pension Plan Type
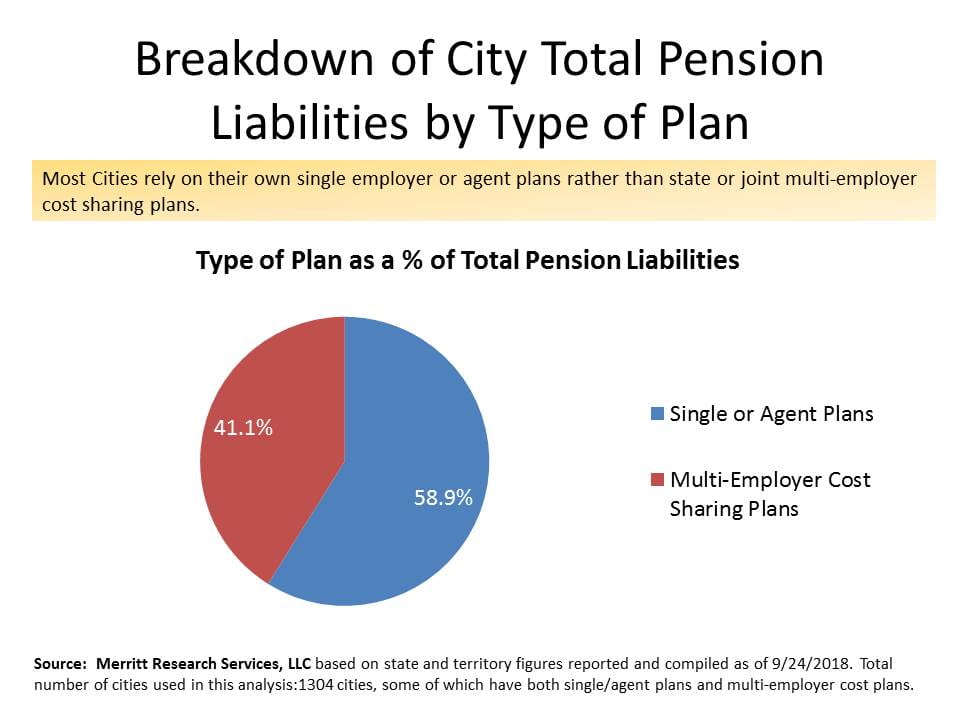
While most government watchdogs focus heavily on single employer public pension plans accountable only to a single city, multiple employer (multi-employer) plans account for about 41% of the total pension liabilities for all city governments. One reason that multiple employer plans don’t get much attention is that the information related to calculating the net pension liabilities for participants in these plans requires additional analytical calculations not normally available in a Comprehensive Annual Financial Report (CAFR) to determine them. In the CAFR, the net pension liability (unfunded liability) is provided for each multiple employer plan; however, the plan’s assets and total liabilities are not. The charts accompanying this article provide a snapshot assessment of a few of the key statistical details derived by Merritt Research Services, LLC to draw some comparisons between single employer/agent plans and multiple employer plans.
The top chart shows the breakdown of total city pension liabilities by either single employer or a cost sharing agent plan (i.e. the city still retains the entire liability) as compared to multi-employer cost sharing plans, which are usually organized by the state, in which the liability is held jointly by more than one employer. Based on an aggregation of fiscal year 2017 pension plans compiled from 1304 cities, fifty nine percent of all city pension liabilities are held in single-employer or agent pension plans. The remainders are in the multi-employer plans.
The second chart found below shows the median pension funding ratios for cities as reported for the fiscal year 2017 Comprehensive Annual Financial Reports, indicating that, by and large, for most cities there is little difference in having the retirement plan managed in a multi-employer cost-sharing plan versus the single employer or agent plans. The combined 2017 median funding ratio for city plans is around 74%, which is just a fraction lower than the median for multi-employer plans but slightly better than the 73% for the single or agent plans. The medians shown were compiled by Merritt Research Services, LLC, an independent municipal and research company. Merritt applied actual reported figures as well as derived calculations based on the employer’s proportion share of the plan liability to determine funding ratios for the multi-employer plans. Each city’s combined funding ratio was also computed by consolidating both types of plans. In addition, Merritt Research provided a hypothetical funding ratio based on a theoretical reduction of the actuarial plan discount rate by 1%, using liabilities reported in the plan’s actuarial study as required under the Governmental Accounting Standards Board Rules 67 and 68. These relatively new rules made it possible to calculate a specific government participant’s liability share in multi-employer cost sharing plans.
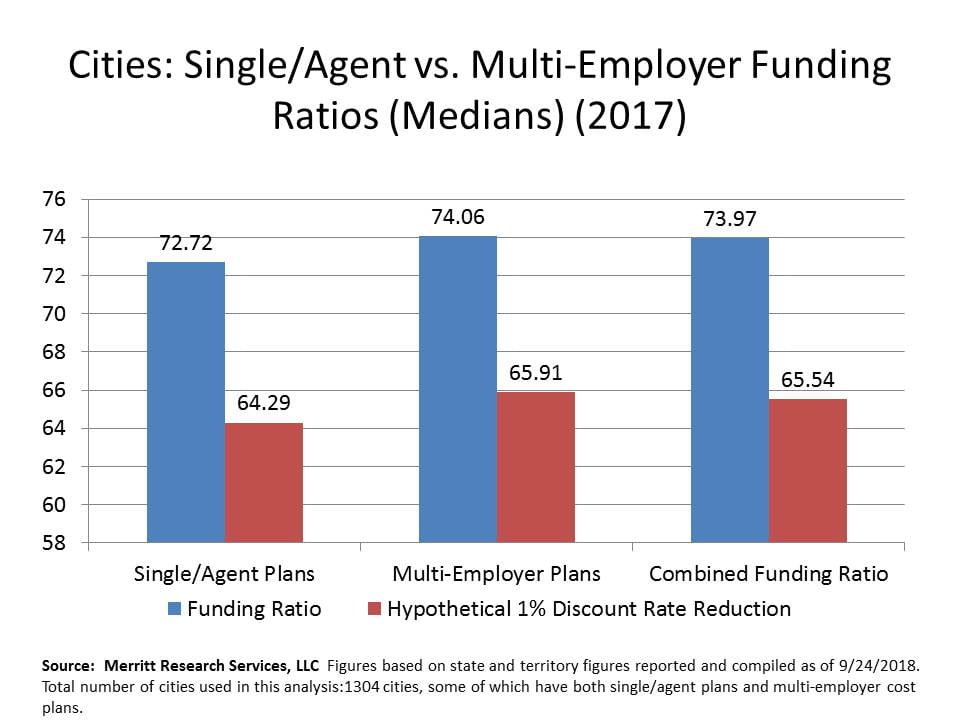
FY17 Funding Ratio for Cities by Type
Richard A. Ciccarone, Co-Publisher of MuniNet Guide