Three Out of Four Metros Having Better Employment Performance In June 2016 Than June 2015
The Bureau of Labor Statistics released their June numbers for Metropolitan Statistical Area (MSA) unemployment and employment metrics. Of the 387 official metro areas in the United States, 285 (74%) saw their unemployment rates drop lower than the previous year’s June 2015 rate. Sioux Falls, South Dakota Metropolitan Statistical Area has the lowest unemployment rate nationally, 2.3%, and El Centro, California MSA currently has the highest, with an unemployment rate of 23.7%. Certain states had interesting results in the June metro employment report.
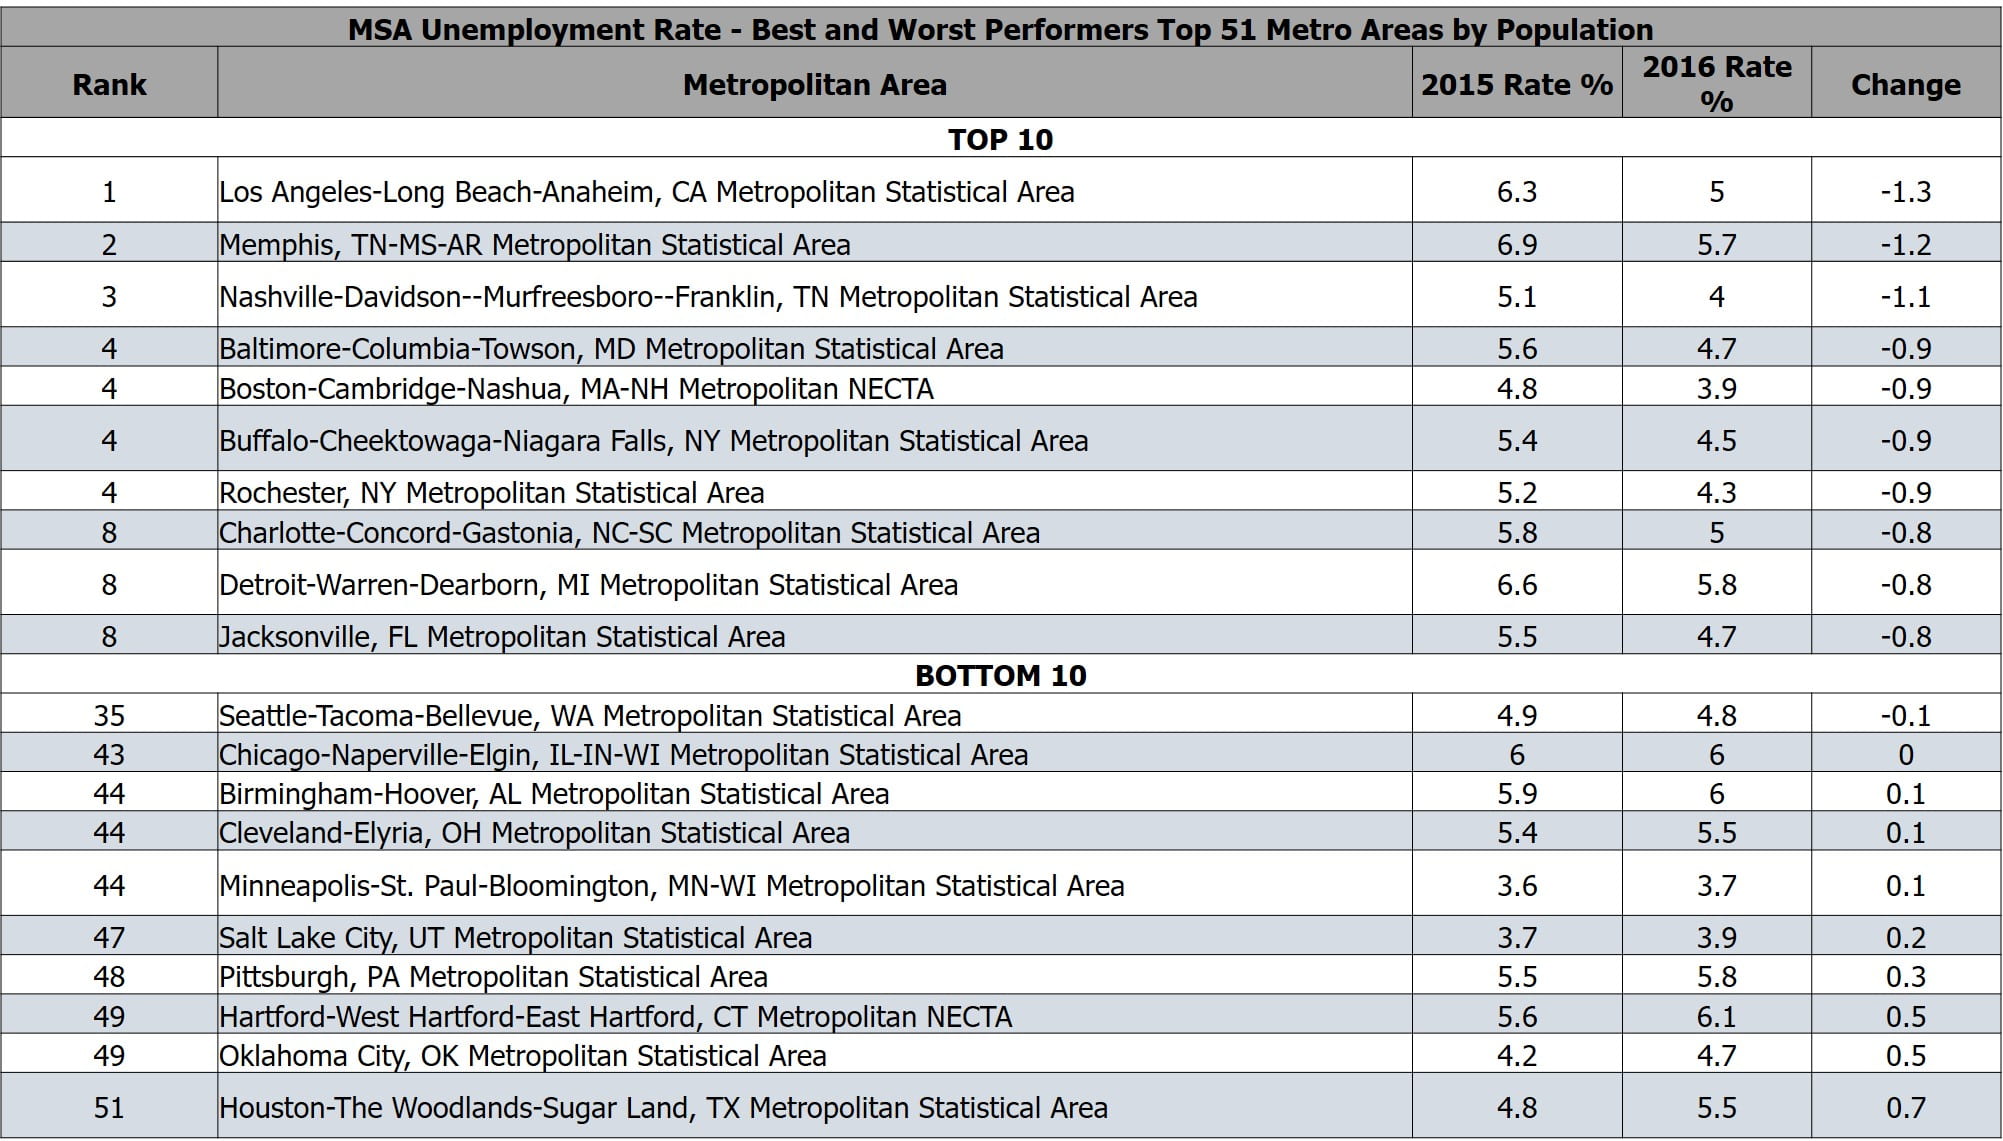
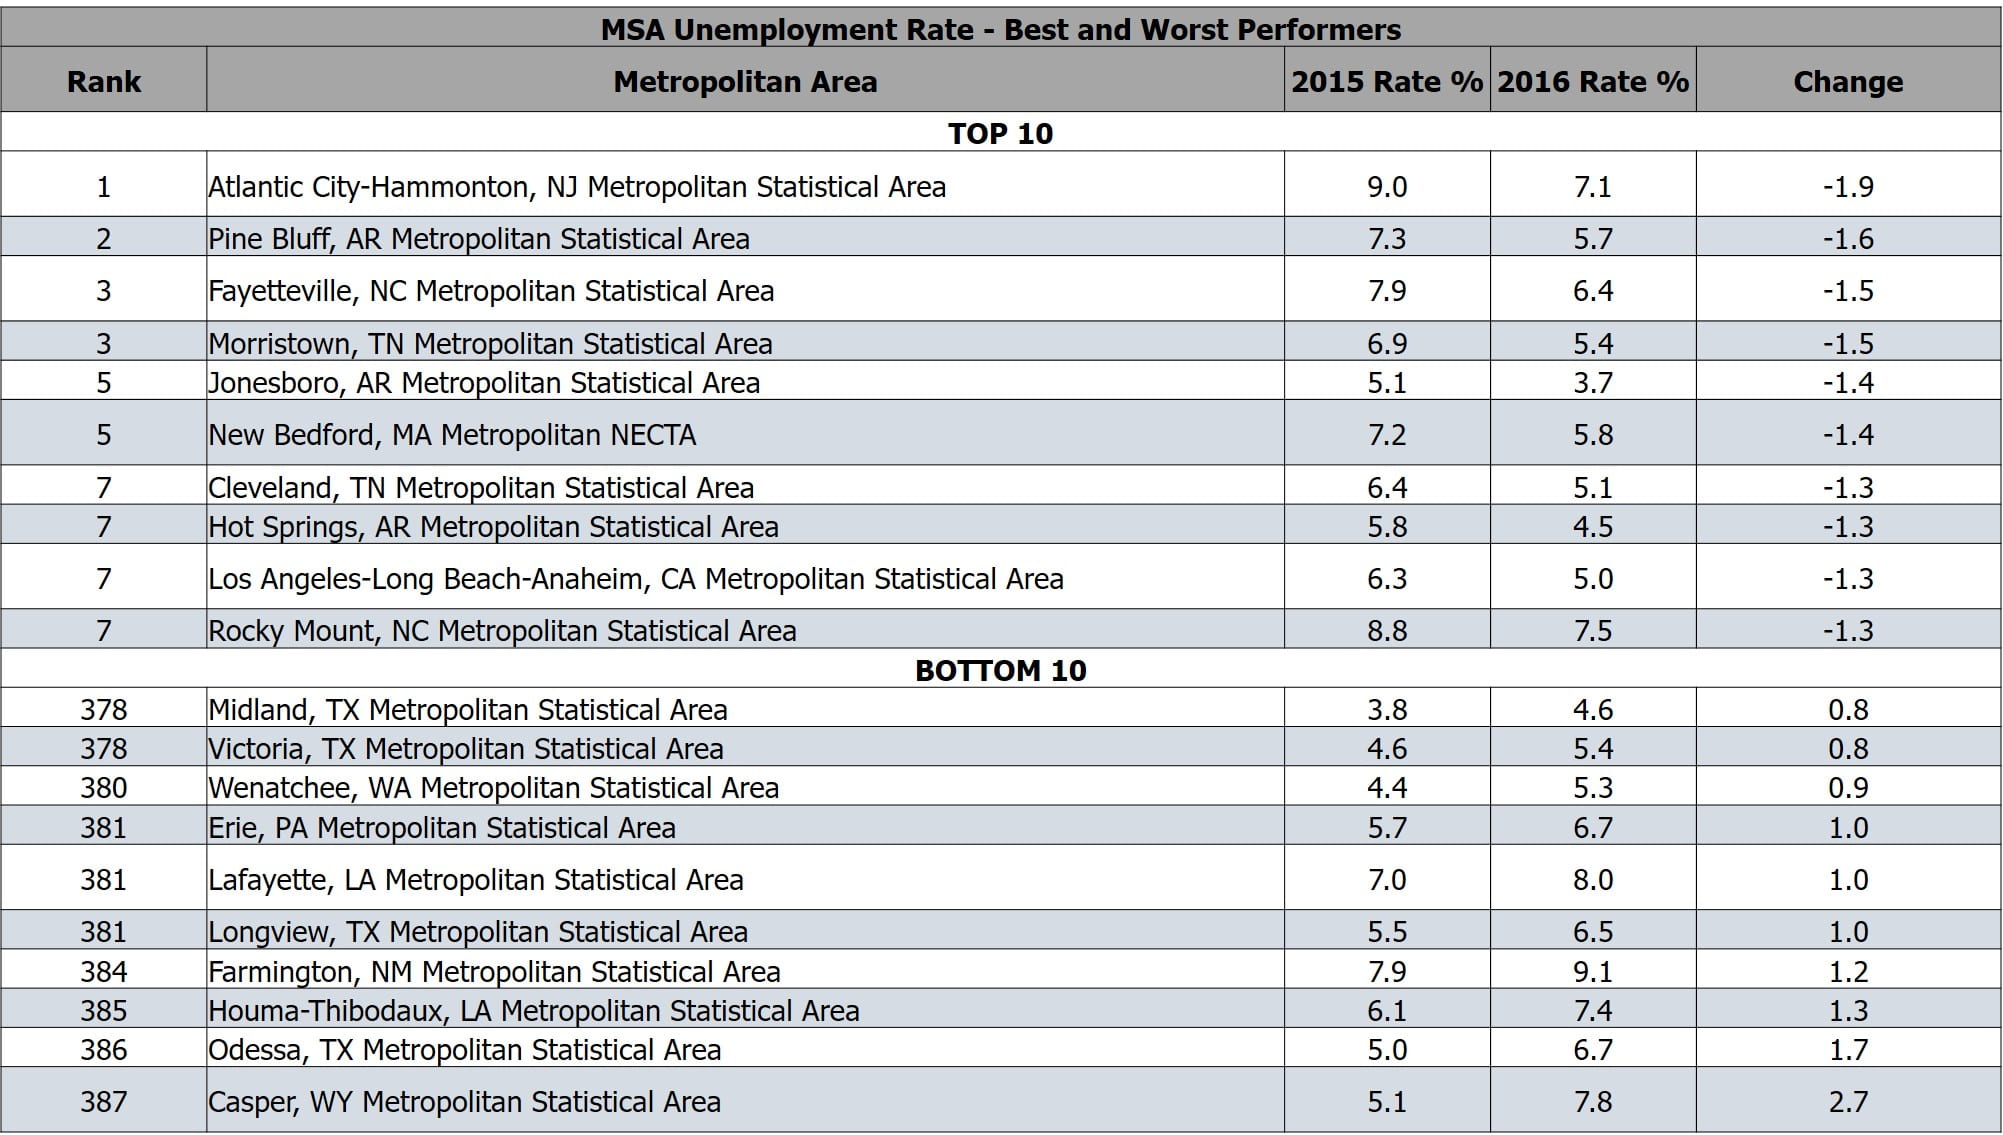
Texas is currently on a concerning trajectory, as four of the ten MSAs with the greatest increase in their unemployment rate from June 2015 to June 2016 are from that state. Arkansas has more MSAs (three) that are among the top ten performers in reducing unemployment than any other state, from June 2015-2016. It should be noted that Texas is worsening, but from a very good overall employment situation. Arkansas is improving from a poor employment situation. The following two charts show the Metropolitan Statistical Areas that had the biggest changes in their unemployment rate between June 2015 and June 2016. The first chart includes all of the Bureau of Labor Statistics’ MSAs, and the second chart contains
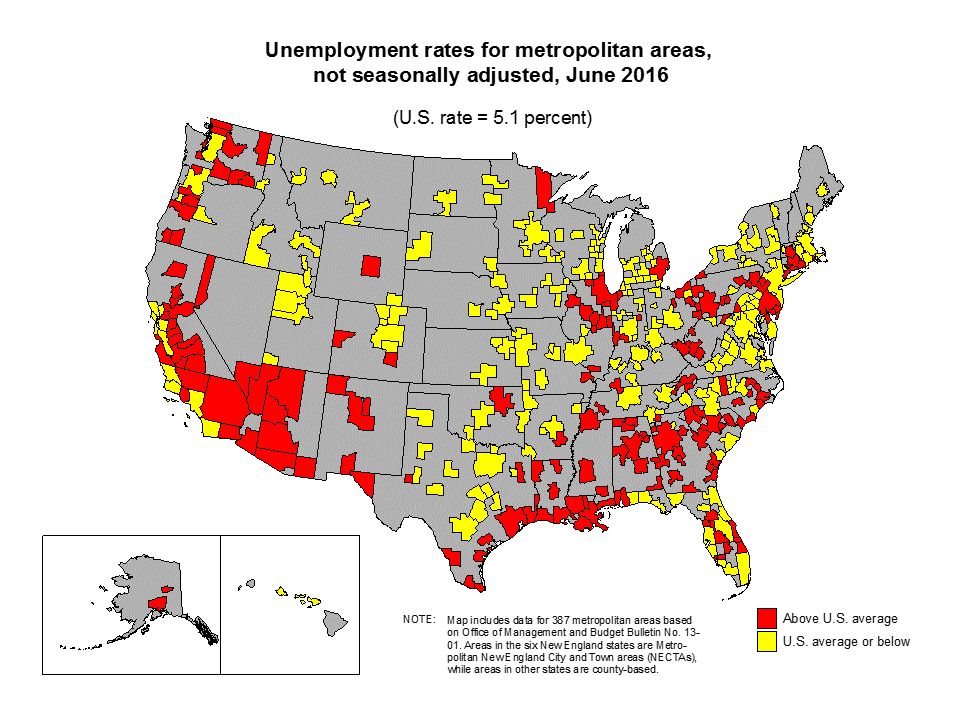
This map provides a visual representation of the metropolitan areas and how they are performing. Yellow means at or below the average unemployment rate, and red means above the average. Clear clusters are visible. For example, a wide swath of yellow runs through most of the great plains area, while the southwest outside Utah and the California coast is all red.
U.S. Bureau of Labor Statistics
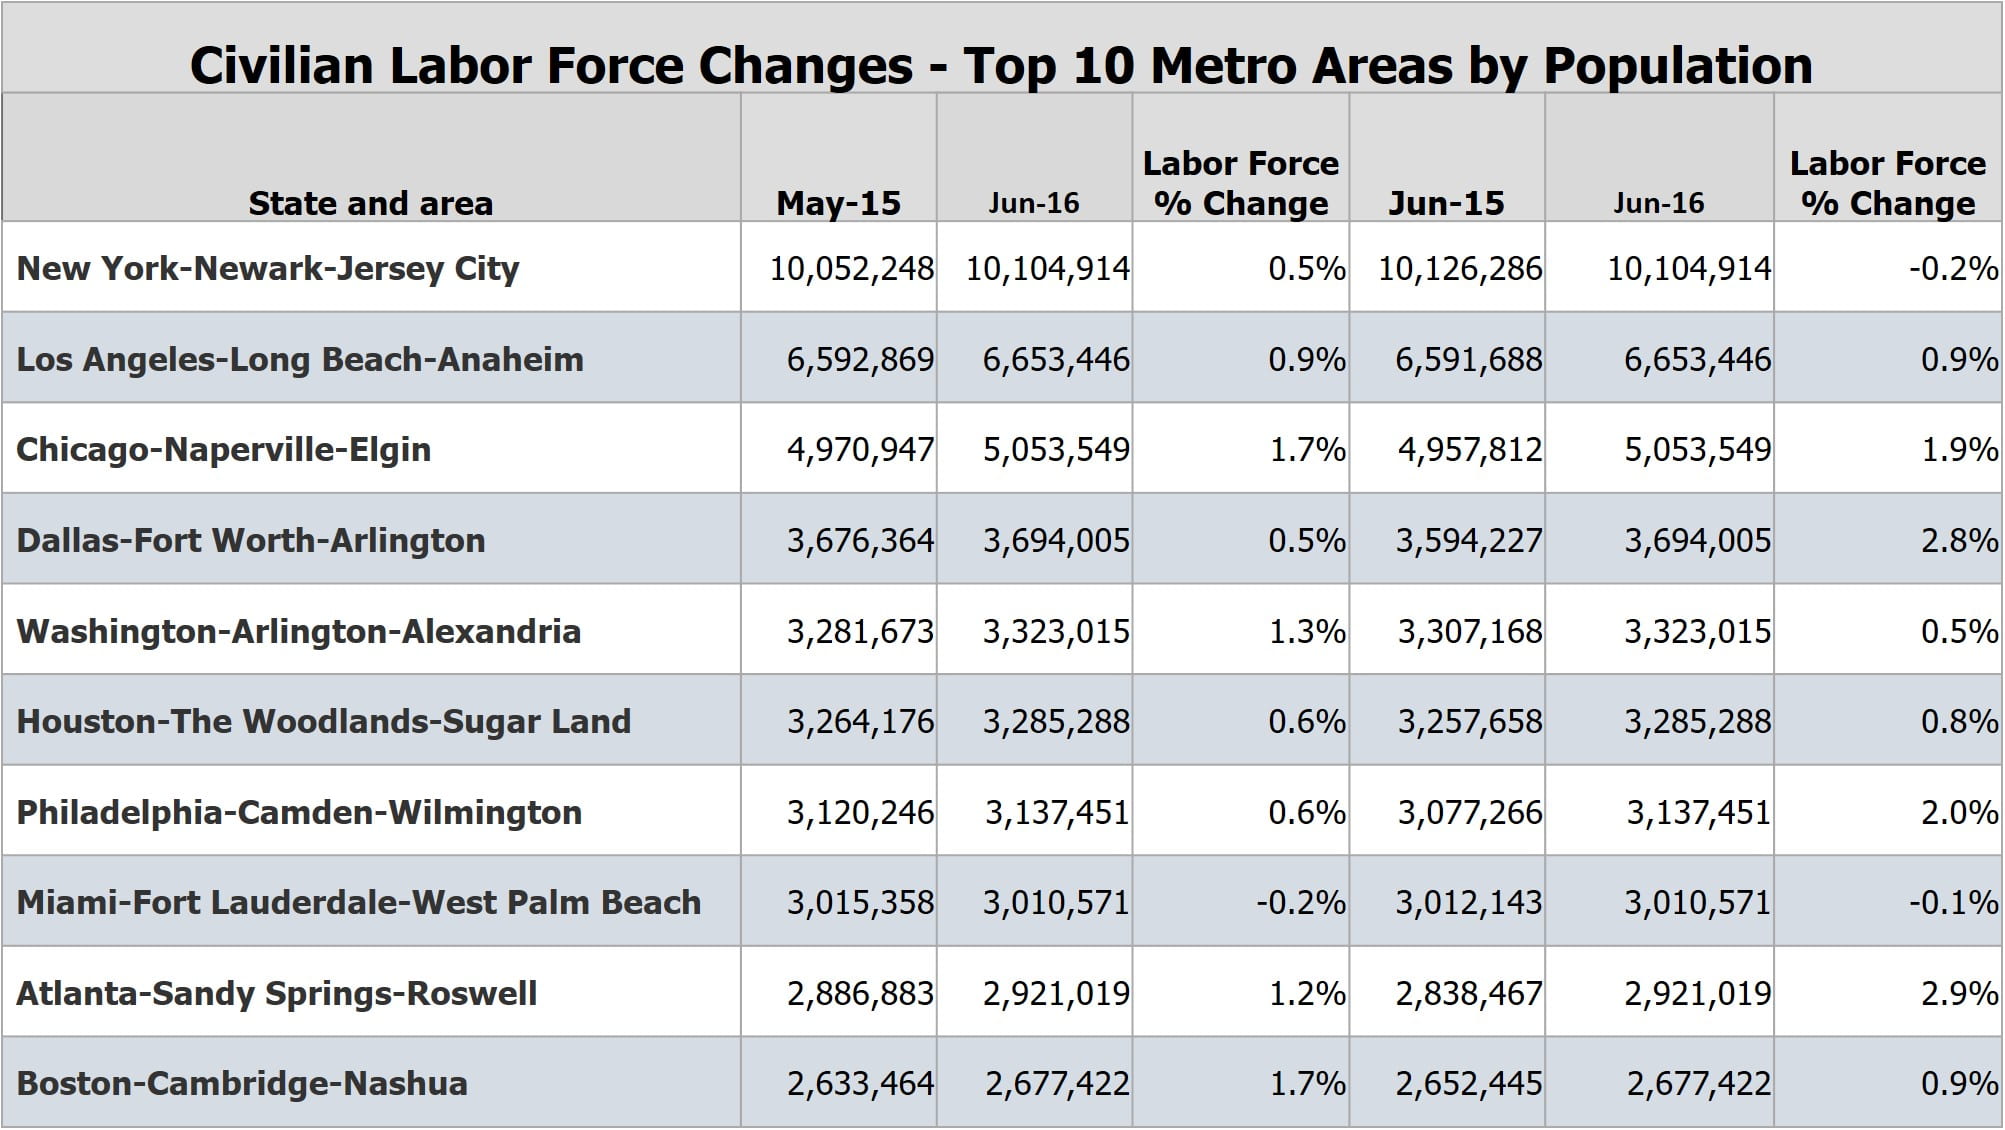
Labor force data has also been released, and can give us a different context when looked at in conjunction with the unemployment rate. A metro area that has a fast growing labor force may see increased unemployment, but that may have more to do with the existence of a lag time between new labor force participants entering the workforce and actually being employed. New labor force participants can be graduating students or people moving into the metropolitan area.
The changes of the ten largest metropolitan labor forces in the nation are listed in the table below. Atlanta, Dallas and Chicago labor forces have seen strong growth over the past year, while the Miami and New York labor forces have decreased in population. MuniNet has taken the publicly available labor force totals from BLS and calculated the labor force percentage changes over the past month and past year. You can find the labor force changes for all states and Metropolitan Statistical Areas by clicking here.
by Jeffrey L Garceau