The most basic sign that a government is living within its means is that it balances its books at the end of the year.
Traditionally, most city officials, experts, and observers of state and local government focus primarily on the general fund, usually a government’s largest discretionary fund for day-to-day operations, to make this assessment.
by Richard A. Ciccarone
In reviewing FY 2014 financial results provided by Merritt Research Services, LLC on nearly 1,200 cities of all sizes in the U.S., the percentage of cities with a general fund deficit (after transfers) hit a six-year low: Only 30% spent more than they generated in revenues during the course of the year. That’s considerably better than the worst year for general fund deficits over the past nine years, which occurred in 2009 when the majority of cities (58%) outspent their year’s revenues. Every year since the credit crisis, the percentage of cities experiencing deficits has been lower than the year before.
… the percentage of cities with a general fund deficit (after transfers) hit a six-year low: Only 30% spent more than they generated in revenues during the course of [FY 2014].
Among the nation’s 34 biggest cities (“Big Cities”), those with populations over 500,000, the trend has been similar but not as steady since 2009. For FY 2013, 41% of Big Cities spent more than they generated in revenues. Their worst spending gaps occurred during fiscal years 2008 and 2009 when 62% of America’s largest cities incurred general fund deficits. For fiscal year 2014, Big Cities incurred deficits at in about the same proportion as all cities at around 30%. The shock in the economy hit hardest in 2008 and 2009, when many cities without flexibility to lower costs, raise revenues or tap reserves took it on the chin.
Balancing the Books and Keeping Reserves
When deficits do occur, cities that have prudently set aside reserves tend to withstand the tough times with greater ease.
Possibly the strongest evidence that cities have generally bounced back from the credit crisis – at least on the operating level – is the trend and absolute standing of median total fund balance compared to general fund expenditures. A fund balance represents the bottom line on a traditional fund accounting balance sheet that takes into consideration what’s left after the fund’s liabilities are deducted from assets and a limited set of receivables as defined by modified accrued accounting.
With 1,172 cities counted for fiscal year 2014, the median fund balance ratio was 33%, which exceeds the pre-credit crisis level of 29% in 2006. The median fell as low as 26% in 2010. Using a more conservative approach to that narrows the amount available for inclusion to just the assigned and unassigned portions of the fund balance, cities still look strong as a group, with the median for FY 2014 at 25%, up from 22% in FY 2011, when Governmental Accounting Standards Board (GASB) standards first required reporting of these figures.
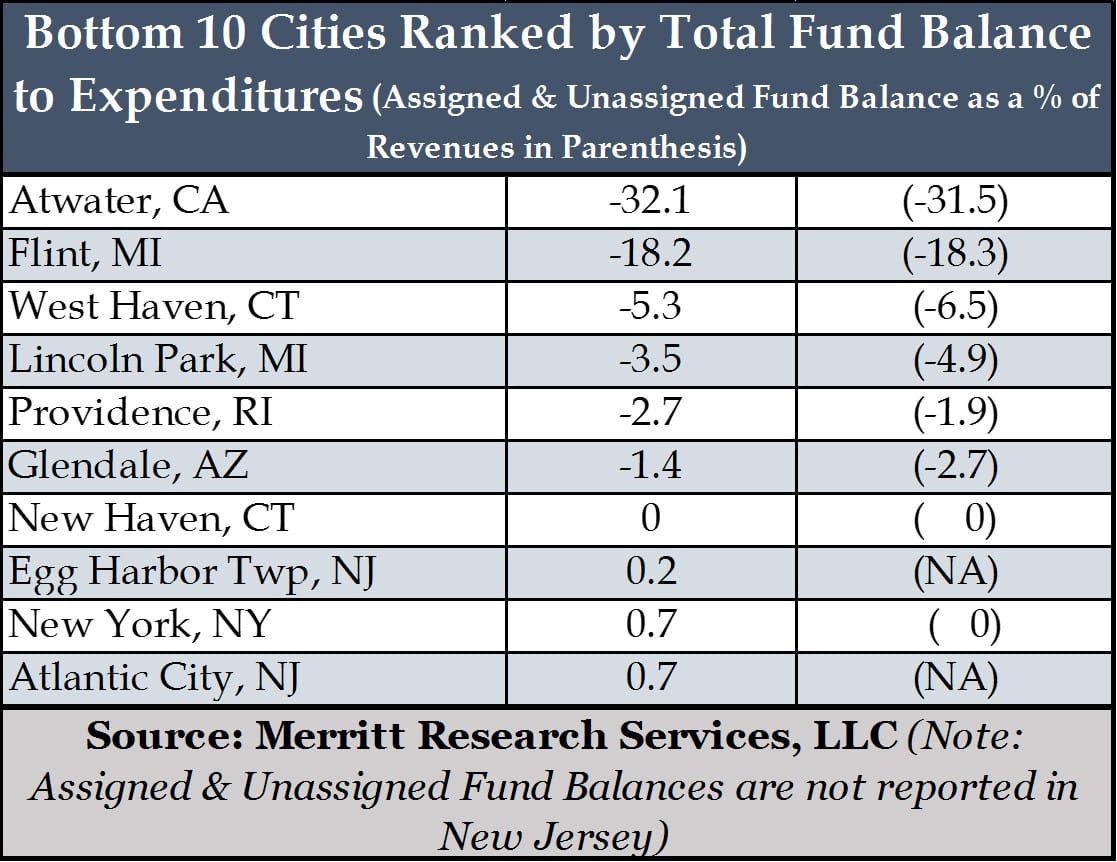
Cities vary dramatically when it comes to the assigned and unassigned fund balance ratio, ranging from as high as 379% in the mostly industrial city of Industry, CA to as low as -32% in Atwater, CA in FY 2014. By comparison, Flint and Detroit, MI registered assigned and unassigned fund balance ratios of -18% and -13%, respectively, in 2014. Out of approximately 1,133 cities reporting this ratio, only 11 (0.9%) cities were in negative territory. Perhaps one of the important takeaways conveyed by this measure of financial condition is that most cities maintained a positive general fund position, enabling them to avoid any serious threat to their day-to-day operations throughout the credit crisis and beyond.
As a subgroup, Big Cities managed to stay in positive territory during the credit crisis, but they did not fare as well as all cities partially because their cost structures are higher, including expenses for more social support services, and their revenues often more vulnerable to cyclical sources. From 2006 to 2009, Big Cities saw their total fund balance to expenditures fall from 23% in 2006 to 15% in 2009 with a subsequent rebound to 19% at the end of the 2014 fiscal year. Related to the more discretionary and unencumbered version of the fund balance ratio, Big Cities have seen their assigned and unassigned fund balance ratio grow from 9.7% in 2010 to 13.5% in FY 2014. Prior to the GASB rule change that occurred late in the last decade, the discretionary portion of the fund balance was labeled as “unreserved.”
During the Great Recession, some big cities like Philadelphia and Detroit actually fell into the “red zone” relative to unreserved fund balance to revenues. Philadelphia’s assigned and unassigned fund balance to revenues ratio fell to -8% in both 2008 and 2009. The lower fund balance ratios for Big Cities didn’t necessarily raise any alarms for the rating agencies.
Despite the fact that nearly 90% of all Big Cities have a AA rating by at least one of the major rating agencies, their median (assigned and unassigned) fund balance ratio was much lower than for all “AA” rated cities, which ranged between 23% and 26% during the period 2006-2013. (Rating bracket medians are based on the highest of the most recent non-credit enhanced ratings).
Cash is King
Relative level fund balances do not necessarily mimic the strength or weakness of a city’s cash position. Whenever economic conditions deteriorate suddenly, or significant surprises arise that require cash for essential or emergency spending without help from outside sources such as borrowing, cities may have to look to the bounty of their own cash reserves to provide them the liquidity they need.
Lack of access to cash, third-party lines of credit or ready market access can seriously hamper the ability to maintain necessary operations or, in remote cases, avoid an interruption in debt service payments if monies haven’t already been set aside.
Whenever economic conditions deteriorate suddenly, or significant surprises arise that require cash for essential or emergency spending without help from outside sources such as borrowing, cities may have to look to the bounty of their own cash reserves to provide them the liquidity they need.
As a measure for adequate cash and liquidity, Merritt Research data provides individual city and comparative numbers on how many days of cash are on hand at the close of the fiscal year. Although the measurement point applies only to the last day of the fiscal year, fiscal analysts have found the number helpful in sorting out generally which cities and other governmental entities are more prone to keep adequate reserves generally. Moreover, we have observed that there is a fairly significant correlation between fiscally distressed cities and cities with low cash (usually the most vulnerable being those with 30 days or less cash on hand in the general fund or governmental activities accounts).
Most cities have improved their liquid positions in recent years. The median general fund cash position for all sized cities ended the FY 2014 with a median level of over three month’s cash on hand (106 days). This is up markedly since the low point for cities when the median days cash on hand was only 81 days in the general fund in 2010. The picture appears even rosier when the broader measure of cash is used applying to all governmental activities. In that case, the median for all cities for FY 2014 comes in at 242 days up from the low point of 207 days in 2011.
By contrast, Big Cities held their ground, but not as well as the rest of U.S. cities. The median general fund cash position for Big Cities sank as low as 37 days in FY 2010 (down from 62 days in 2006) before rebounding to near 60 days in FY 2014.
Like the trend for all cities, the cash position in the broader governmental activities accounts remained substantially stronger than for just the general fund over the past ten years for Big Cities, with a range between a low of 132 days in 2008 to high of 173 days in 2014. While the general fund provides the greatest source of discretionary spending for a government, monies in other funds, such as the special revenue, capital improvements and debt service funds, can provide “restricted” funds that can ease the burden on the general fund if it were required to pay for a designated public purpose. These other funds can also offer a cushion of support for debt service or, in some cases, interfund borrowing and sometimes transfers to the general fund.
By looking at a consolidated number, taxpayers as well as bond investors, have a better feel for the full liquid potential of a government to fulfill its responsibilities.
The median general fund cash position for Big Cities sank as low as 37 days in FY 2010 (down from 62 days in 2006) before rebounding to near 60 days in FY 2014.
A number of cities do not carry even close to the median represented for all cities. We found that 84 out of 1,172 cities (7%) finished their fiscal year with 30 days cash on hand or less in the general fund; albeit only four of those cities didn’t have at least 30 days cash on hand in the governmental activities accounts either. In some cases, bank lines of credits cover a seasonal cash flow issue at the end of the year if eligible internal cash is not available. Having little or no cash at any point in time is a serious vulnerability often found among distressed cities.
Richard A. Ciccarone is a Co-Publisher of MuniNet Guide. He is also President and Chief Executive Officer of Merritt Research Services, a municipal bond credit database and research company that primarily serves institutional investors, investment dealers and bankers.
Coming soon: “Assessing the Credit Quality of America’s Cities – Part Five: The Bottom Line,” which will focus on the measures that depict short and long-term financial position. (This will be the conclusion in this five-part series.)
Did you see the earlier installments of this series?
Part One: Focusing on Bond Ratings
Part Two: The Achilles Heel to the Fiscal Condition of Cities – Public Pensions
Part Three: Long-Term Liabilities Beyond Pensions