MuniNet Takes a Look at Public Criminal Justice Data Available to Answer Questions
Criminal justice and public safety are some of the most frequently discussed and scrutinized government functions. One of the reasons for its persistent importance is that crime is something affecting the quality of life of every and any nation, state, or locality. An increase in crime in your neighborhood is sure to impact all living there to one degree or another.
There is plenty of controversy and politics involved in the common discourse, and there are many economic and philosophical considerations that are measured when determining what constitutes a successful fight against crime. Those dilemmas are serious, but not ours to resolve. Yet, the discussion has raised a few questions; is crime getting worse? Are police more prevalent in our daily lives, and is the general infrastructure of law enforcement expanding? Is the population of law enforcement officers becoming more diverse, or less?
Whether the answer to these question is ‘yes’ or ‘no’ certainly depends largely where you live. The residents of each state, city, and neighborhood have their own unique perspectives, and none are necessarily wrong. However, while surveying America is beyond our scope, we thought we would look at publicly available government data, to get a view of the overall national picture. Looking at how things are going for us as a country can shed new light on how we view the situation of our own communities.
The Data
Focusing on law enforcement personnel, crime rates, incarcerations, and total population, our data was pulled from three government sources; the Federal Bureau of Investigation (FBI), the Bureau of Justice Statistics (BJS), and the U.S. Census Bureau. The FBI provides law enforcement agency and personnel totals via their annual Uniform Crime Reports. The accuracy and methodology of the Uniform Crime Reports have been questioned and critiqued for decades. Survey data is collected from all jurisdictions in the United States; reporting is voluntary and, due to the limited resources available, confirmation of reported data is limited. While many years see reporting rates of 92% or better, some years are markedly lower. Despite these characteristics, the Uniform Crime Reports are unmatched in their scope for collecting national law enforcement data, and the consistency of collection through the decades does provide for useful analysis of trends over time.
The Bureau of Justice Statistics is our source for crime and incarceration data, and is an excellent source for raw data and analysis of criminal justice statistics. The crime data comes from the FBI Uniform Crime Reports. The BJS houses the data, but the collection is technically performed by the FBI. The crime data of the Uniform Crime Reports is much more controversial than the personnel data; many crimes go unreported or underreported, how crimes are categorized has a degree of subjectivity, and there may be political incentives for jurisdictions to try to keep reported crime numbers low. Collection of incarceration data is done by the BJS directly, through their National Prisoner Statistics program. The NPS is a collection of state prison and court records, which the BJS has studied for accuracy.
The U.S. Census collects population data for the entire country decennially, as well as the monthly Current Population Survey. Due to its universal importance, the U.S. Census Bureau is arguably the most critically studied government survey, and is frequently assessed internally and externally for revisions to improve accuracy. While no data collection method is perfect, the Census Bureau’s has a strong reputation.
Regardless of the reason, it is clear that the nation as a whole has seen officers and agencies have a greater population for which they are each responsible.
The Results
We looked at several relationships between different data sets over time. These include the number of agencies and sworn officers per capita, the relationship between crime rate and sworn officers, the rate of officers that are female, the relationship between incarcerations and crime, and how incarcerated population has changed in relation to the overall population.
Less coverage: First, let’s look at the trend in police and agency proliferation in relation to the overall population. The chart below shows the number of sworn officers per 100,000 U.S. residents, as well as the number of agencies per 100,000 residents, from 1995-2014. There are peaks in the number of officers per population that coincide with the United States’ slipping into recession, followed by clear declines. The number of agencies has shown an even steadier decline trend line, from 5.31 agencies per 100,000 residents in 1995 to 4.72 in 2014. While it appears that there is an overall downward trend, the number of officers fluctuates with economic conditions, which is similar to how the general labor market works. In 1995, there were 239 sworn law enforcement officers per 100,000 residents in the United States. By 1999, this number had increased to a peak of 252 officers per 100,000 residents. Through peaks and valleys, the number of sworn officers per 100,000 residents has decreased to a twenty-year low of 234 as of 2014.
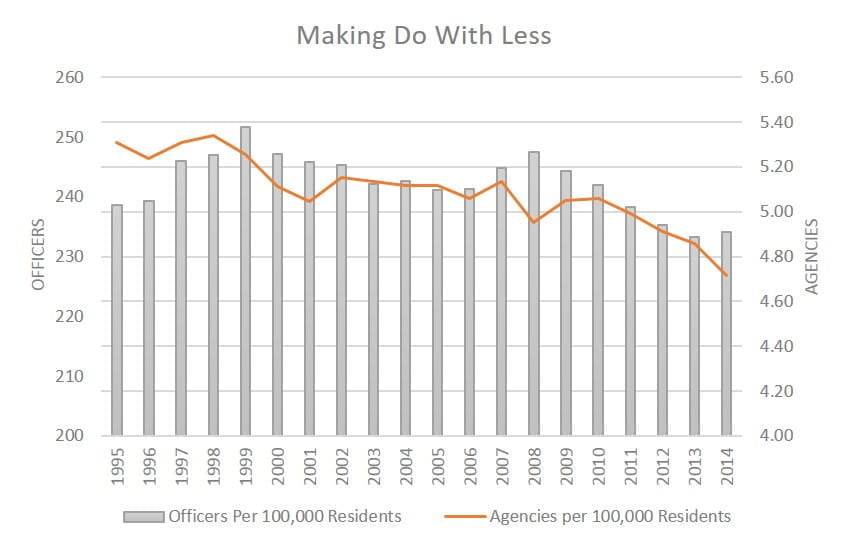
Source: Federal Bureau of Investigation Uniform Crime Reports
The steadier decline of agencies could be the result of many factors. Most obviously would be that jurisdictions are seeing population increases that do not see an expansion of police agencies. Local governments can and do merge, which would eliminate agencies. State and local governments in the aggregate have been on a long decline in fiscal health; outsourcing of law enforcement activities could also be a contributing factor. Regardless of the reason, it is clear that the nation as a whole has seen officers and agencies have a greater population for which they are each responsible.
Fewer officers, fewer crimes: How has the reduction in overall coverage corresponded to crime rates? The chart below looks again at officers per 100,000 U.S. residents, but this time plots the overall crimes per 100,000 residents, from 5,275 in 1995 to 2,962 in 20014 combining violent and property crime. The past twenty years have seen a steady reduction in the crime rate. In fact, the overall crime rate has increased from one year to the next only once, increasing slightly from 4124.8 in 2000 to 4162.6 in 2001. There are clearly many variables that impact the crime rate, but increased police officer coverage does not appear to be one of them. The crime rate has steadily declined, whether officers per population have increased or decreased in a given year.
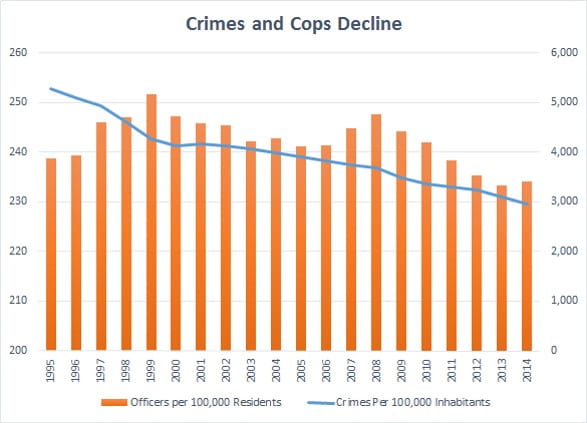
Source: Federal Bureau of Investigation Uniform Crime Reports
More women on the force: When first looking into the law enforcement personnel data, we initially planned to investigate minority representation in the overall police officer population. Unfortunately, the Uniform Crime Report does not collect data on law enforcement personnel broken down by ethnic background. We were not able to confirm whether this information is not requested on the survey, or whether it isn’t reported because the FBI deems the results to be statistically insignificant or otherwise unreliable. However, the Uniform Crime Reports do provide information on sworn officers and other personnel by gender. Looking at the data from 1995-2014, we see a fairly consistent increase in female representation. The increase has been slow; women went from representing 10% of sworn officers in 1995 to 12% in 2014.
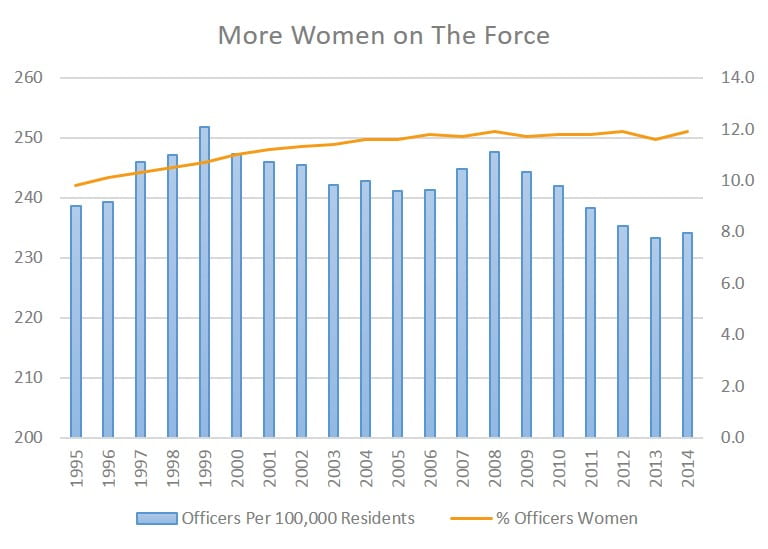
Source: Federal Bureau of Investigation Uniform Crime Reports
The real story: There is a lot of news coverage in current media about the United States’ high incarceration rates. Political debates have been highlighting that the United States has the highest incarceration rate in the world. There is bipartisan support at the Federal level to decrease incarcerations, from a social justice perspective, a libertarian perspective, and an economic perspective. The graphs below show the movements of prison populations and the crime rates in the United States from 1978-2012. The number of incarcerations has increased from 307,276 in 1978 to 1,570,397 as of 2012, an increase of 411%.
It is important to note that these are not apples-to-apples comparisons. The prison population graph shows total year-end populations for all Federal and state correctional facilities, including all crime types. However, it does not include private prison populations. The crime rate graph shows the total crime rate nationally for violent and property crimes, but does not include crimes that fall under the category of ‘crimes against society’, which include many non-violent drug crimes, illegal gambling, drunk driving, and other crimes. However, the mirrored movements of steady increases in the incarcerated population, and steady declines in the total crime rate, are striking.
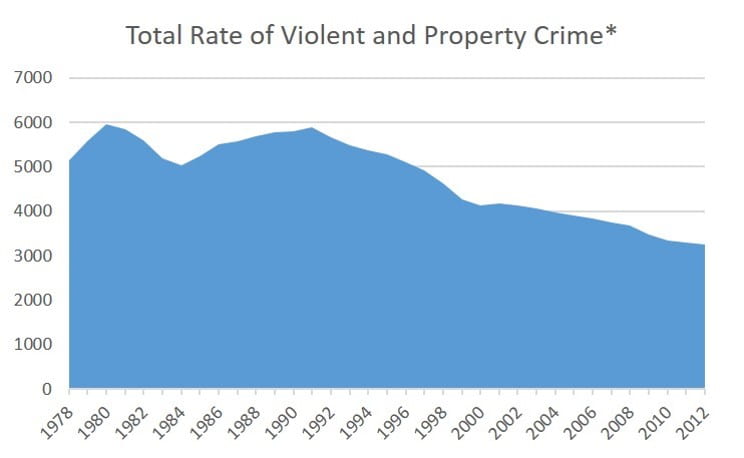
Source: Federal Bureau of Investigation Uniform Crime Reports *Rate is per 100,000 residents per year

Source: Bureau of Justice Statistics Prisoners under the jurisdiction of state or federal correctional authorities, December 31, 1978-2014.
Clearly, growth of the prison population outpaced overall population growth for nearly a quarter century.
It wasn’t always this way: MuniNet also compared the growth in the total prison population to the growth in the total U.S. population, and the graph below shows exactly that. When looking at the changes of these two populations from 1978-2012, once can see a clear difference in growth rate. The graph is not intended to show any sort of proportionality of the prison population as a percentage of the overall U.S. population. Rather, while one sees a steady, relatively shallow upward trend line for the U.S. population, the trend line for the national prison population sets on a much steeper growth rate from about 1980-2006. Clearly, growth of the prison population outpaced overall population growth for nearly a quarter century, meaning that a higher percentage of the overall population was steadily being incarcerated. Precisely, the population of the United States increased by 41.1% from 1978-2012; the incarcerated population increased by 411.1%.
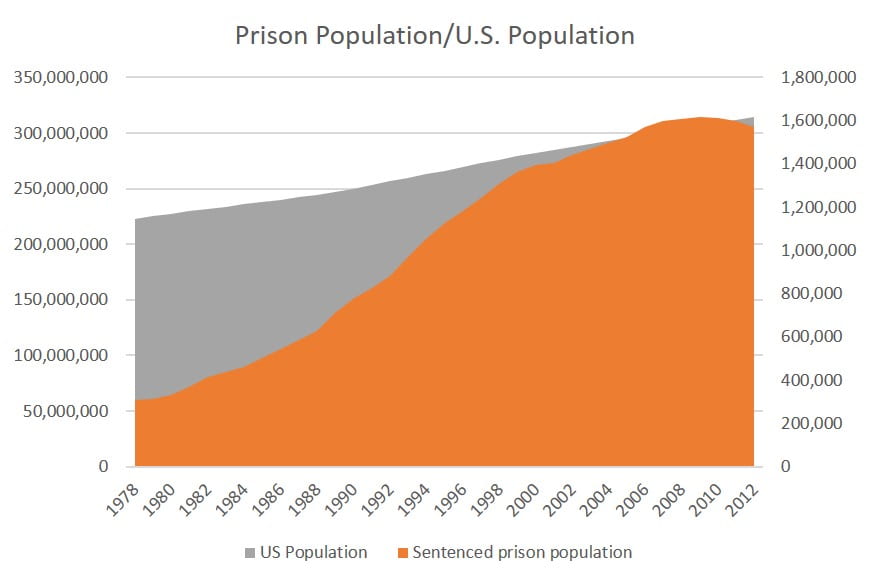
Sources: U.S. Census Bureau Population Estimates Historical Data; Bureau of Justice Statistics Prisoners under the jurisdiction of state or federal correctional authorities, December 31, 1978-2014.
The trends we discovered do not necessarily add up to a definitive or comfortable conclusion. A higher percentage of Americans keep being incarcerated. Crime rates have greatly diminished. Both of these trends could be in spite of or have led to decreased police officer and agency coverage per capita, or could be entirely unrelated. Female representation in the national police force is steadily improving, but from a gender standpoint, the law enforcement population is not at all representative of the population they protect and serve. We do not draw conclusions here as to the benefit to society and inmates of incarceration, or the worthiness of prison and law enforcement reform efforts, but hope to provide some context when interpreting various policy and ethical claims about the criminal justice system one is almost certain to encounter elsewhere.
Population Data
Bureau, U. C. (n.d.). Population Estimates, Historical Data. Retrieved from United States Census Bureau: https://www.census.gov/popest/data/historical/
Incarceration Data
- Ann Carson, S., & Joseph Mulako-Wangota, I. T. (n.d.). Prisoners under the jurisdiction of state or federal correctional authorities, December 31, 1978-2014. Retrieved from Bureau of Justice Statistics: http://www.bjs.gov/index.cfm?ty=nps
Crime Data
Investigation, F. B. (n.d.). Uniform Crime Reporting Statistics: State-by-state and national crime estimates by year(s). Retrieved from Bureau of Justice Statistics: http://www.bjs.gov/ucrdata/Search/Crime/State/StatebyState.cfm?NoVariables=Y&CFID=118953052&CFTOKEN=763ad4a3fa4427e-14B846FC-A9DA-5B13-6CDE3C521605A413
Personnel Data
Investigation, F. B. (n.d.). Uniform Crime Reports. Retrieved from The FBI: Federal Bureau of Investigation: https://www.fbi.gov/about-us/cjis/ucr/crime-in-the-u.s
by Jeffrey L Garceau