By James E. Spiotto
This is Part 3 in a 4-part article series on the Post-Fiscal Crisis State and the next fiscal crisis considerations. The information and charts come from a presentation given at the Government Finance Research Center’s conference entitled “Ready or Not? Post-Fiscal Crisis/Next Fiscal Crisis” held on May 2-3, 2019 at the Federal Reserve Bank of Chicago.
To read part 1 click here. To read part 2 click here.
The Shared Economy and artificial intelligence – automation creates new challenges in the reliability of traditional taxing sources and the need to recalibrate to match the economic shifts to new sources and ways to tax and raise revenues for the government of the future. Comparison of sources and ranking of levels of taxation by State and some MSAs help put into focus the strengths and weaknesses of various state taxing policies and the need to adjust those policies to the evolving changes caused by the digital revolution and the Shared Economy. These comparisons help indicate what areas of taxation that have comparative room for increase, those that have comparative need for decrease and what new source can be developed for the future. The lessons learned in the 1930s Depression where 60- 70 % of State and Local tax revenues was real estate based during a real estate downturn exacerbated and prolonged the financial problems. Diversity and sustainability of tax sources is the hallmark of government success.
This article will look at three different aspects of the evolution of taxing policy:
1. Analysis of tax revenue source of Illinois and Midwest States.
2. Will digital and shared economy revolution threaten traditional tax revenues sources mandating changes in tax policy and focus?
3. The need to reexamine the future viability of current tax revenue sources and consider new policies and sources for taxes to survive the digital, shared economy and artificial intelligence revolution.
1. Analysis of tax revenue source of Illinois and Midwest states:
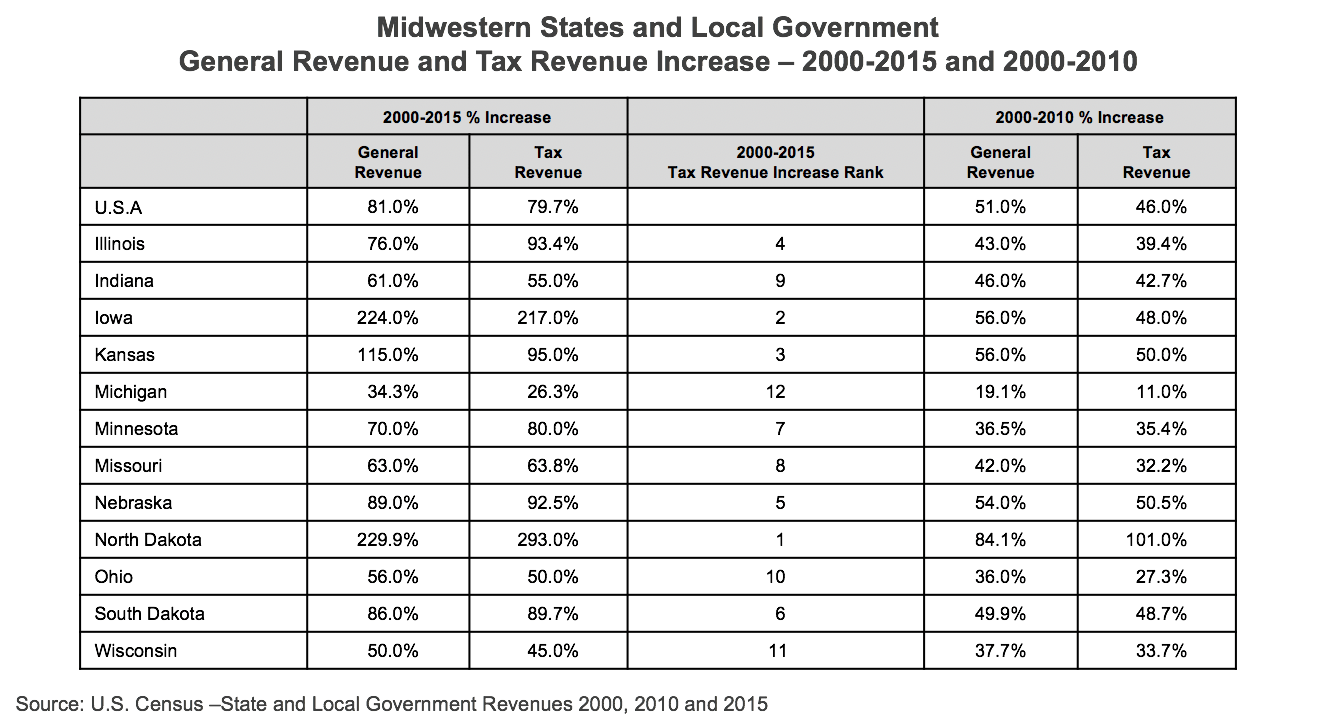
Tax revenue increases 2000-2015. Illinois tax revenue increase between 2000-2015 was 93.4% which was higher than the U.S. average of 79.7%. Seven out of twelve Midwest states had tax revenue increases above the U.S. states average of 79.7%, namely: North Dakota (229.9%), Iowa (217.0%), Kansas (95.0%), Nebraska (89.0%), South Dakota (89.7%), Illinois (83.4%) and Minnesota (80.0%). There were two Midwestern states with below 50% increase in tax revenue between 2000-2015, namely Wisconsin (45.0%) and Michigan (26.3%).
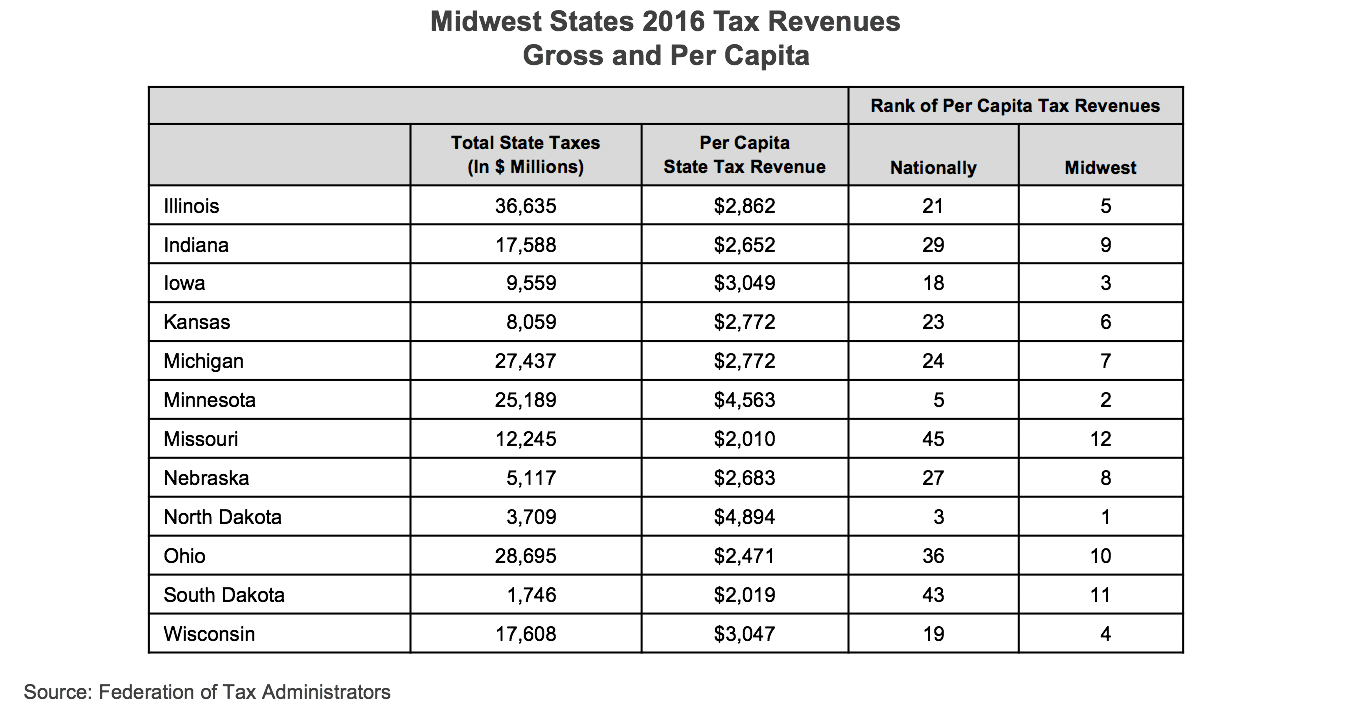
State revenues, gross and per capita, 2016. In 2016, Illinois was ranked 21st highest in tax revenues per capita nationally and 5th highest in the Midwest. With the exception of North Dakota (3) and Minnesota (5), the remainder of the Midwest states ranked between 18-45, nationally. Most of the Midwest states are in the middle of the range of per capita tax revenues. Eight out of twelve Midwest states are in the top half of U.S. states nationally for highest per capital state tax revenue in 2016. There are three states of the non-Midwest comparable states that are in the top ten states with ten highest tax revenues per capita, namely Connecticut, New York and California.

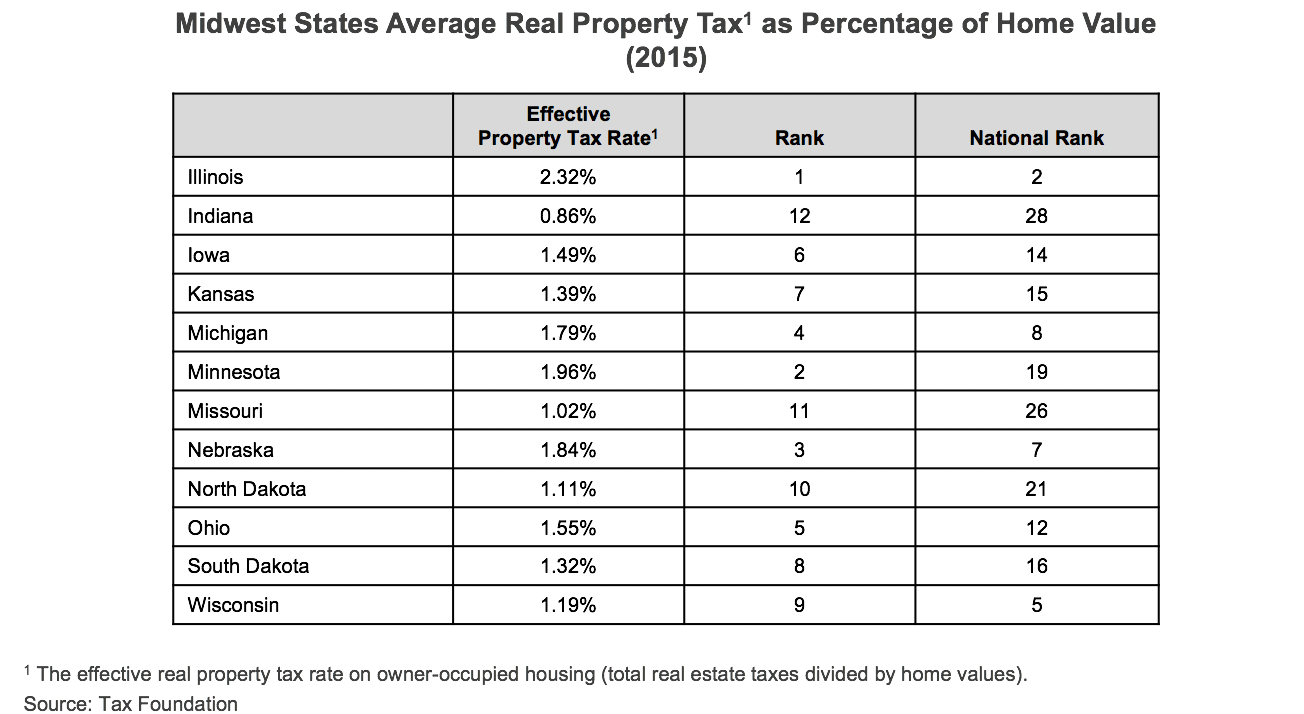
Effective property tax rates for Midwest states, in general, are higher than U.S. states average by national rank. Illinois effective property tax rate was ranked the highest in the Midwest and 2nd highest among the U.S. states. Two Midwestern states rank in the top five for effective high property tax rate, namely Illinois (2) and Wisconsin (5). All but one of the Midwestern states rank in the top 26 states by effective tax rate. The one exception was Indiana (28).

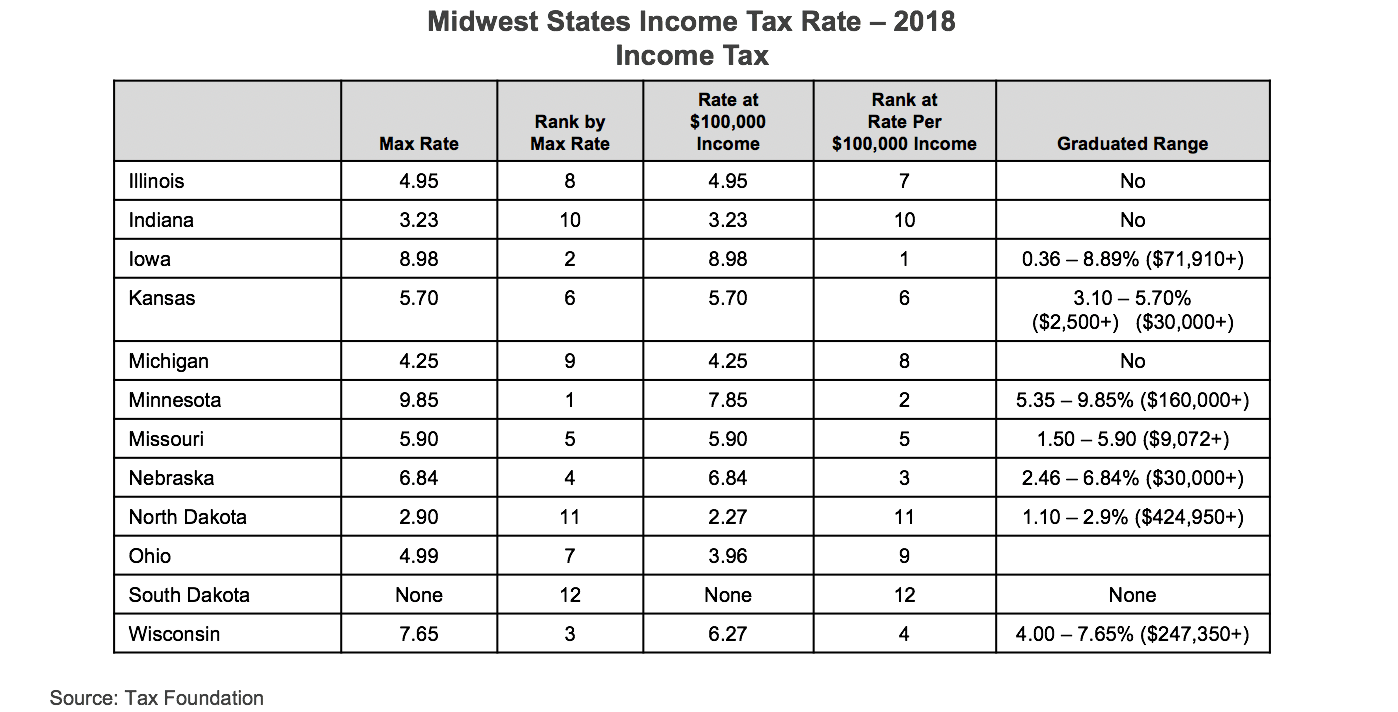
Analysis of individual income tax rates for Midwestern states and other comparable states. The max rate for income tax for the Midwestern states range from 2.9% to 9.85% with no income tax for South Dakota. Of the eleven Midwestern states that have a tax rate three, Illinois, Indiana and Michigan, have a fixed rate and the others a graduated rate. In 2018, Illinois income tax rate for individuals for a $100,000 taxable income was 7th in the Midwest. Compared to other non-Midwest states, California has the highest tax rate of 13.3% and a rate of 9.3% for $100,000 of taxable income. Texas, Nevada, South Dakota, Wyoming and Washington have no income tax.

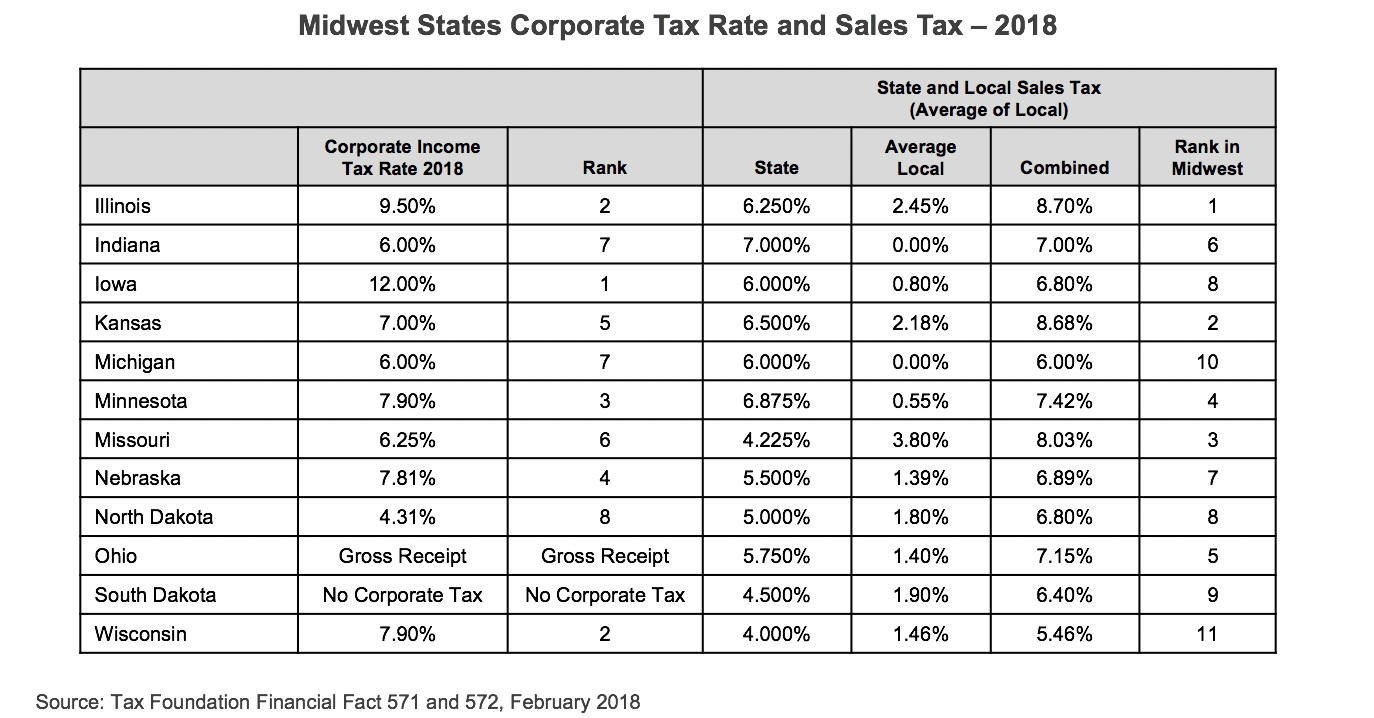
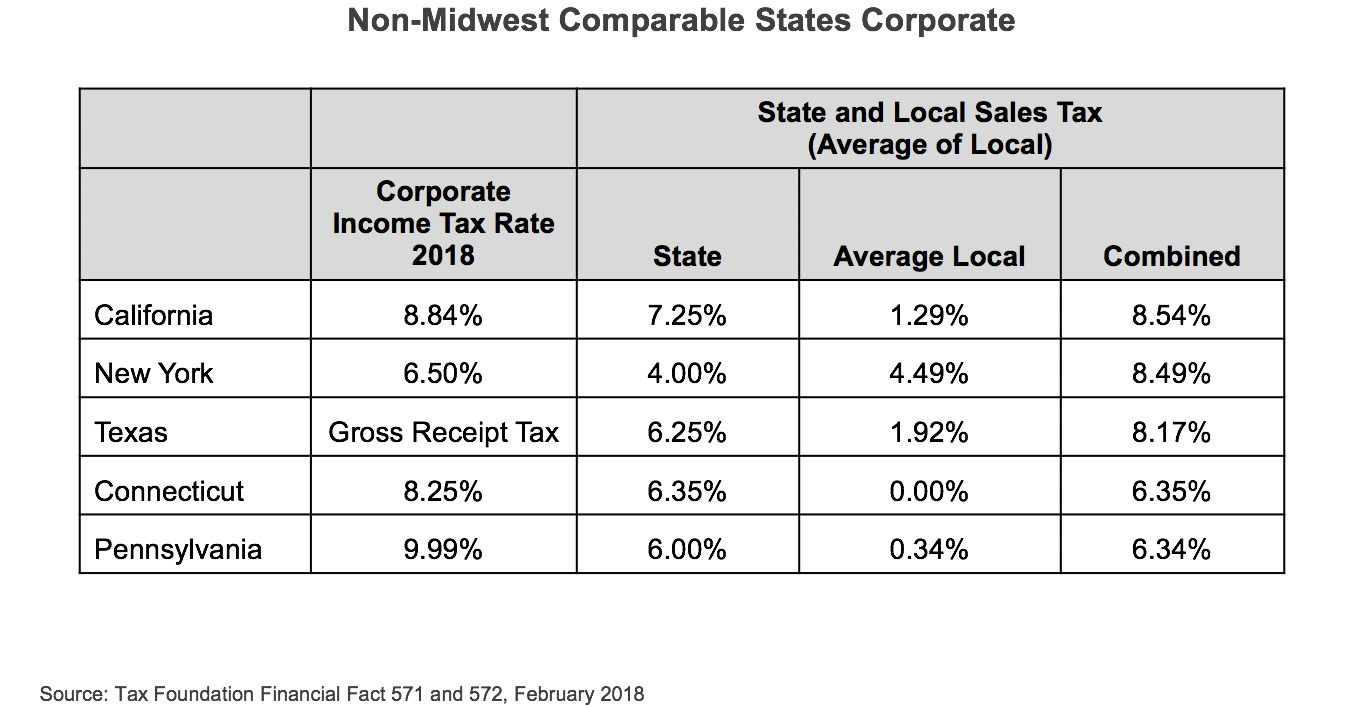
Corporate tax rates Midwest states and comparables 2018. Illinois’ corporate income tax rate in 2018 was 2nd highest in the Midwest and state and local sales tax was the highest in the Midwest. The range for corporate tax rates for 2018 for the Midwest states is 4.31%-12.00%. Two states have no corporate income tax, namely: South Dakota and Ohio (but Ohio has a gross receipt tax). Obviously the ability to attract new businesses and to have current business expand has some relationship to corporate tax rates. The top three corporate rates in the Midwest are Iowa (12.0%), Illinois (9.5%) and Minnesota (7.9%).
Sales tax rates for Midwest states. State and local sales tax in the Midwest ranges from a combined 5.46% to 8.70% based on the average local sales tax. In Illinois, the sales tax number is based on the average for local government and the effective highest sale tax rate is Chicago at 10.25%.
2. Will digital and shared economy revolution threaten traditional tax revenues sources mandating changes in tax policy and focus:
Diversification of tax sources to prevent over-concentration of source of funding: Since the Depression of the 1930’s, state and local governments have diversified the source of tax revenues to reduce reliance on property taxes and to spread the burdens and reduce the risk of concentration. That diversity of tax sources has made a real difference in the eleven economic downturns since 1949, especially in 2008.
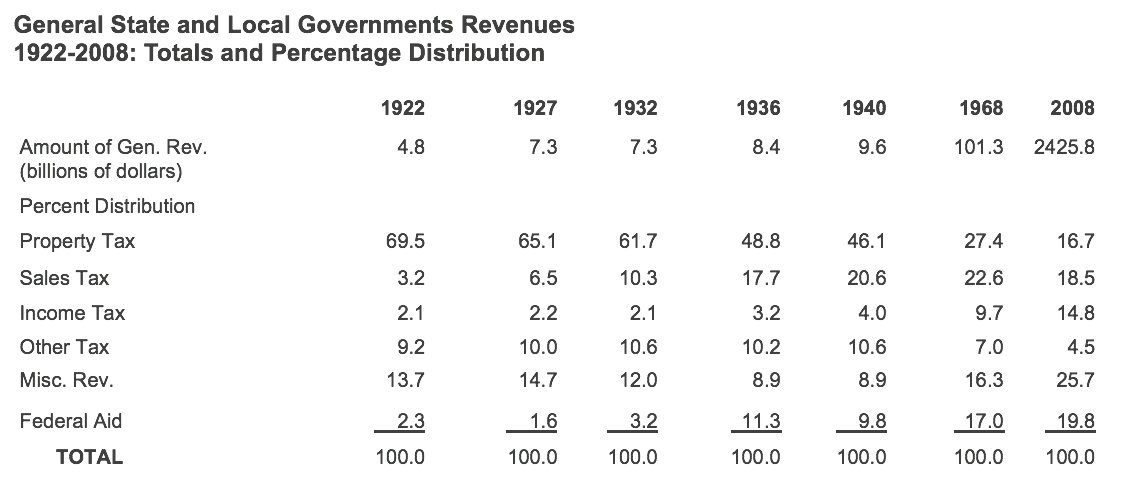
Property, income and sales taxes made up over 70% of state and local governments revenues in 1922-1940 but only 50% of state and local governments revenue by 2008. More diverse and varied tax base in 2008 with more federal assistance. Property taxes which made up over 60% of the revenues of state and local governments between 1922-1932 was only 16.7% of revenue by 2008 with increases in sale, income other, miscellaneous and federal aid making up the difference.
But will this diversity of tax sources and strength of tax revenues and collections be true for the foreseeable future? Not necessarily. The digital, shared economy and artificial intelligence (automation) revolution has put the strength of diverse tax revenue sources into question:
- Online sales. Increased online sales will threaten traditional sale tax receipts and, as online sales increase and the sale tax revenues are not collected or not collected in the jurisdiction the purchaser resides, there will be a loss of sale tax revenue from the traditional sale tax government tax collector. Amazon Distribution Centers are not located in major metropolitan areas where the bulk of the Amazon purchasers reside. The U.S. Government Accountability Office estimates the loss of sales tax revenues due to online sales to be $8 billion to $13 billion in 2017 while the National Conference of State Legislatures and International Council of Shopping Centers estimated the sales tax loss to the states in 2015 to be $26 billion.
- Autonomous electric cars by 2026. California Department of Transportation predicts major highways in California may well be, by 2026, restricted to electric level IV autonomous cars. What will happen to gas tax revenues and related bond issues, or employees in manufacturing of combustion engines, vehicles and related fields, e.g., car repairs or sales? What will be the effect of the probable reduction of employed workers in related fields of oil and gas, refineries, auto and auto parts, manufacturing for combustion engines, vehicles and machines, auto repairs, etc., which is estimated to decrease 20-30% each year after 2025, and the resulting loss of those workers’ income tax and sale tax revenues and increase in unemployment benefits?
- Shared economy. With autonomous electric cars used by Uber and Lyft, and the reduction or virtual elimination of private ownership of vehicles, what is the result in lost parking lot tax revenues (since cars do not park all day due to constant use and little individual ownership), loss of employment for parking lot servicing employees and related loss of income tax revenues as well as reduced number of vehicles needed due to the “more efficient use of vehicles by reduced individual ownership”? Also, various equipment used occasionally in home ownership will not need to be purchased individually but will be shared on a collective “rent” or “ownership” basis. Possible significant decrease of taxi fees, traffic violation fines, parking taxes, vehicle registration fees and toll road collections, etc. In addition, Turo allows individual car owners to rent their cars to the public as part of the shared economy.
- Expanded use of automation and artificial intelligence. As automation continues to evolve and workers are replaced by robots, what should be the replacement tax on robots, the cost of out-of-work workers, the lost income and lost sales tax revenues from personal consumption of goods and services? Should there be a robot replacement tax to capture all the lost revenues?
- The increased use of Airbnb. With the Airbnb phenomenon, there will be loss of local hotel and convention taxes, loss of jobs in the hotel industry and possible lack of safety standards for vacation and visitor guest rooms. Most major cities, as well as smaller ones, have made budgets balance and needed capital improvement projects funded by a hotel and convention tax. Those taxes will be difficult to collect, enforce and levy on individual home and apartment owners in this yet to be regulated cottage industry.
Use of debt limitation and tax limitation: Virtually all states impose some sort of limitation on the amount of debt or tax limitations or both. (See Appendix I taken from the recently released Second Edition of “Municipalities in Distress? How States and Investors Deal with Local government Financial Emergencies”). Municipal debt limits range from a percentage of a valuation of assessed property to a monetary amount. Will these limits be appropriate and effective given the effects of the digital, shared economy and artificial intelligence revolution? States handle debt for essential services differently than for non-essential. There have been recent attempts in some states to tighten local debt limits while others strengthen protections.
Generally, revenue bonds paid from the revenues of a municipal enterprise (water, sewer, bridge, tollway, electric system) are exempt from debt limits. So also are tax increment financing and appropriation bonds.
With unresolved obligation for public workers’ unfunded pension and health care costs, as well as growing deferred needed infrastructure improvement costs, at the same time there are decreasing tax revenues compared to traditional revenue source, statutory and constitutional debt and tax limits may need to be increased. What are the good as gold tax revenues that will remain and what new ones need to be developed to avoid increasing tax and debt limits.
Refunding bonds are permitted in all states. But, if the sources of tax revenues are drastically changed by the effects of digital, shared economy and artificial intelligence implementation, what will be the new assured tax revenues of the future?
3. The need to reexamine the future viability of current tax revenue sources and consider new policies and sources for taxes to survive the digital, shared economy and artificial intelligence revolution:
Threat to current financings. If there will be autonomous cars, use of shared economy rooms in apartments and homes and not continued use of hotels, then there will be less use of hotels, cars, parking garages, etc. The future of current financings that have 10-20 years to maturity relying on such taxes on hotel, parking, gas, etc., as repayment sources will be a challenged. The viability and sufficiency of tax sources and general tax policy will need to be examined and refined to meet the challenges of the digital/automation/shared new reality.
Is it too late to start or too early? An analysis of the long-term sufficiency of current source of tax revenues can never begin too early or start too late. Based on the lesson of the 1930’s Depression, if the tax revenue source is the subject of a major change, those financings and funding targets need to be correspondingly modified to deal with the evolving flow of possible tax revenues. Whether there will be an automation tax or robot tax to cover lost tax revenues of displaced unemployed workers or a value-added tax for increased manufacturing productivity due to automation or other new tax formulae or methods of taxing will be the subject of spirited debate and experiment.
What are some of the possible new taxes Illinois and the City of Chicago may utilize in the future?
- Graduated state income tax (9 out of 12 Midwest states have graduated income tax).
- City income tax (like New York City, Philadelphia, Indianapolis, Louisville, Newark, Detroit, etc.).
- City commuter tax.
- Expanding state and city sales tax.
- State or city financial transaction tax.
- Graduated real estate transfer tax.
- State recreational marijuana tax with city sharing.
- New gaming taxes including Chicago casino.
- Expanded property tax.
- City employer expense tax (the old head tax).
- City congestion tax.
- State reduction or elimination of income tax deduction such as retirement income with city sharing.
- Expanded service tax.
- Privatization revenues.
- (See The Civic Federation pros and cons on expanded or additional taxes in State of Illinois BY2020 Budget Roadmap February 13, 2019 and Financial Challenges for the next Chicago Mayor and City Council March 12, 2019.)
To read part 4 click here.