Counties Often Underappreciated Despite Generally Improving Fund Balances and Lower Debt and Pension Liabilities
By Richard A. Ciccarone
County governments are generally a good place to start your search for governments with positive financial conditions as well as lower pension and debt liabilities.
Since the Great Recession and Credit Crisis, counties have shown improving general fund balances, lower debt and better pension funding ratios. These strengths often get overlooked by public finance critics as well as anxious municipal bond investors that are rightfully concerned about the potential retirement burdens impacting many states and cities.
General Fund Balance Trend
One of the best measures to assess operating reserves is to take a look at the general fund balance in comparison to annual expenditures. For fiscal year 2017, the median general fund balance to expenditures was 38.9% based on a sample of 1,107 U.S. counties by Merritt Research Services, LLC. Merritt Research is an independent municipal bond data and research company.
As shown in the table below, the total fund balance ratio is about 10% higher in 2017 than it was in 2009. based on Comprehensive Annual Financial Report audits collected by Merritt Research.
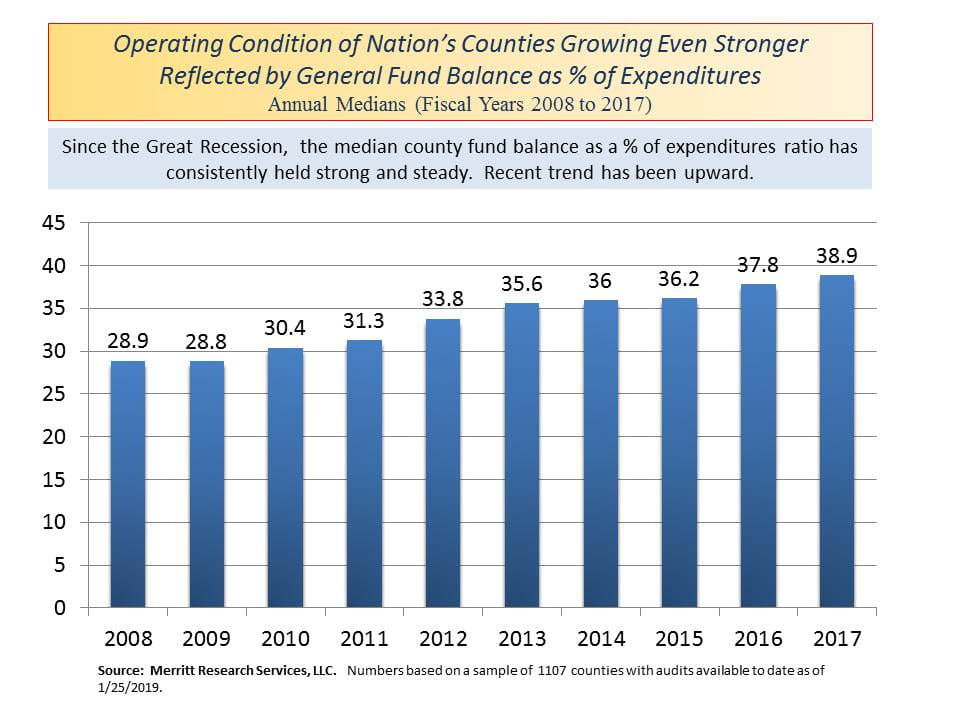
National median and trend of County Fund Balances to Expenditures; Source: Merritt Research Services, LLC
Available Fund Balance
The portion of the fund balances that is available for future spending and reserves is defined by the Governmental Accounting Standards Board as the assigned or unassigned fund balance. The assigned designation refers to balances that are legally designated by statute, resolution or indenture while the unassigned refers to the portion that is totally uncommitted. Converted into a narrower fund balance ratio, this figure is also running on a positive high note.
Most counties have a comfortable margin, providing them with reserves and room to maneuver as evidenced by median ratio of 29.9% of general fund expenditures in FY 2017, which is up from 25.4% in FY 2009. Nineteen percent of all counties in the Merritt analysis of over 1000 counties carried assigned and unassigned fund balances of over 50% of the year’s general fund revenues.
Among the largest of the urban counties with more than 50% balances were: Oakland County, MI (63.9%) located in the metropolitan Detroit area, Cuyahoga County, OH (53.1%) whose largest city is Cleveland and Harris County, TX (50.8%) which is the home of Houston.
Whenever statisticians deal with medians, there is a risk that positive generalizations will provide cover for weak performers.
Among weaker financial condition counties of over 100,000 persons that ended their fiscal years with low assigned and unassigned fund balance to expenditure ratios were Linn County, OR (-29%), Suffolk County, NY (-11.8%), Kankakee County, IL (-10.6%) and Nassau County, NY ( -1.9%). Each of these counties registered in negative territory in FY 2017.
Total Fund Balance Comparison –Counties versus Cities
The majority of counties also fared better than cities as measured by the medians for both groups of local governments. It may be somewhat of a surprise that the improvement among counties is coming primarily from more prudent debt and spending controls rather than the growth in revenues.
Since the property tax provides the bulk of revenues supporting most county governments, the gradual increase in real estate taxes has been positive recently but nothing to boast.
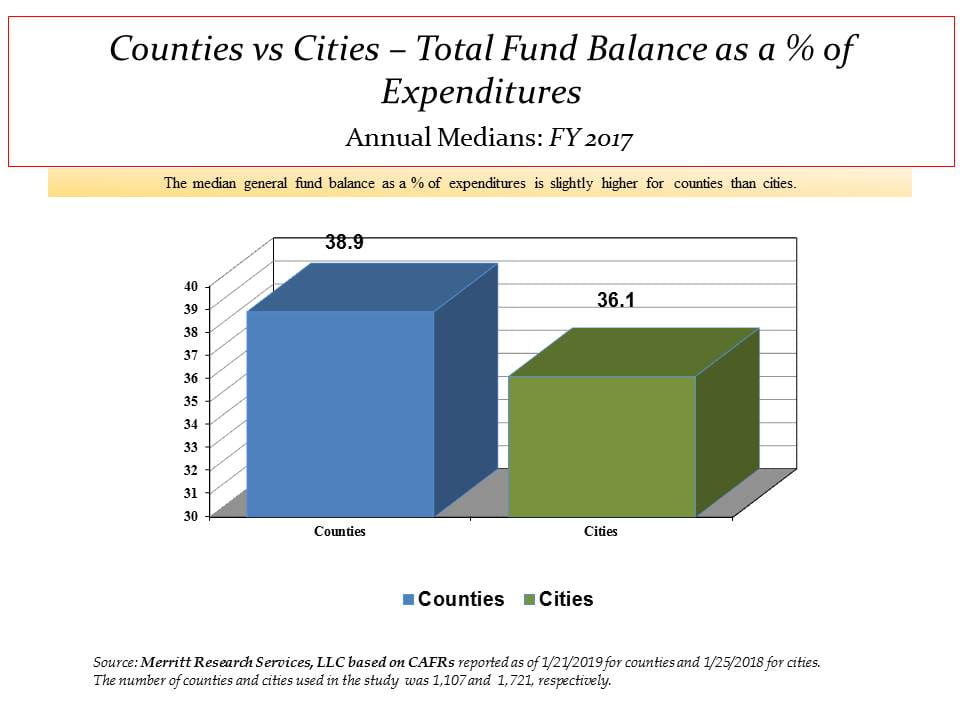
National medians of County and City Fund Balances to Expenditures, Source: Merritt Research Services, LLC
Counties Show Lighter Levels of Debt and Pension Liabilities than Cities
The median net direct debt plus unfunded pension liability per capita for cities was more than four times higher than for counties based on Fiscal Year 2017 annual audits.
The pension load portion of the consolidated debt and pension figures includes both single and multi-employer cost sharing progams in order to account for differences that exist in different states that provide state participant plans. Pension plan funding figures that are often cited in the press refer to only one or the other but not a blend of both liabilities attributed to a single government.
The chart below shows that median consolidated net direct debt plus total unfunded pension liablity per capita ratio for over 1,000 counties, which was only calculated by Merrritt Research to be only $312 compared to $1,364 for cities.
One explanation for the big gap is that most counties employ fewer employees to perform less labor intense functions than cities, which contributes to the lower pension burden per capita. Moreover, counties located in larger urban areas often are not responsible for as much of the infrastructure as the cities and villages, which holds down the tax supported debt loads.
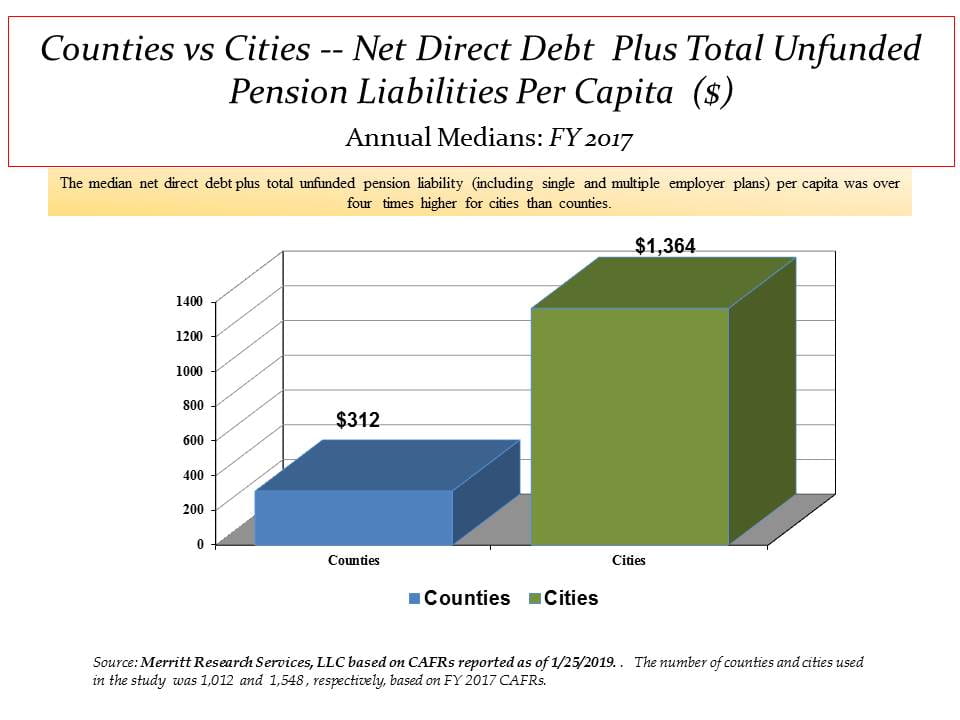
County Net Debt and Pension Liabilities Lower than for Cities Based on Medians. Source: Merritt Research Services, LLC
County Pension Funding Levels are Higher than for Cities
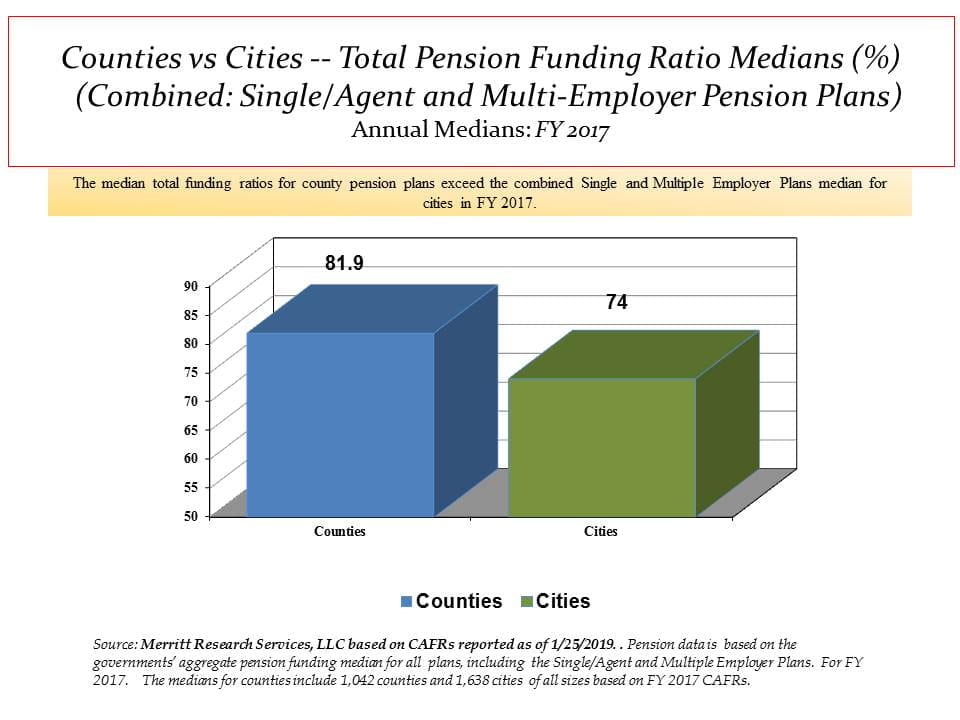
The median total funding ratio for counties was higher than cities in Fiscal Year 2017. County vs City 2017 pension funding ratios. Pension plans include single and multi-employer plans,
The median total pension funding ratios for counties exceeded the medians for cities in fiscal year 2017. While counties showed a combined funding ratio of nearly 82%, the median for cities was only 74%.
To calculate the total funding ratios, Merritt Research combined each government single or agent pension plans and as well as any proportionate share of a government’s participation in a multi-employer cost sharing program such as a state sponsored pension plan.
The funding range for both types of governments varied widely with the honors for the best showing among counties went to Kalamazoo County, MI at 129.4% and the lowest funding level on the list belonged to Blair County, PA at 29.1%, the home county for Altoona.
Richard A. Ciccarone, Co-Publisher of MuniNet Guide and President of Merritt Research Services, LLC