
Public Higher Education Debt Outstanding Has Grown by Over 80% Since 2007 Leading All Other Major Municipal Bond Credit Sectors
by Richard A. Ciccarone
Municipal Bond Credit Sectors — Ten Year Outstanding Debt Trend
Based on municipal bond credit sector medians, Public Higher Education and Community Colleges registered the biggest increases in long term debt outstanding — more than any other major credit sectors observed in the municipal bond market during the period 2007- 2017. Universities and colleges saw a ten year growth of 85.2%, the most of all major municipal bond sectors tracked by Merritt Research Services LLC, an independent municipal data and research company that tracks financial conditions on over 10,000 municipal bond borrowers. Long term debt attributed to Community colleges followed close behind with an 80.7% growth rate. The ten year time span used in the comparison included the Great Recession as well as the subsequent recovery years.
Higher education institutions, in general, have incurred higher debt loads for capital improvement programs over the past two decades, triggered by a “keeping up with Jones'” mentality that swept the board rooms of college administrations. The wave of more expansive and luxurious campus facilities at competing colleges and universities was motivated in part on the grounds that the shrinking pool of eligible college age potential students required them to provide state of the art facilities. Private higher education institutions, many of which started their capital programs earlier than public institutions, ranked fifth in their median debt expansion with a smaller but still robust 39.6% growth rate.
In the case of community colleges, expansion programs heated up as public officials responded to the demand for lower cost institutions available for families seeking a lower cost option to either reduce the cost leading to a four year degree or a path providing more specific job preparation and training..
On the other side of the debt trend scale, wholesale electric agencies, also called joint action agencies, whose primary purpose is to generate or jointly purchase power on behalf of or to resell to mostly local municipal utilities, saw their outstanding debt loads fall by 23.8% over the past ten years, the biggest percent drop among all the major credit sectors tracked Merritt database. Public power borrowers, which also include retail electric utilities, have seen their debt loads and new capital outlay requirements shrink in line with greater reliance on smaller, less expensive generating plants, more purchased power from surplus suppliers and conservation efforts. Since 2007, retail municipal electric utilities lowered their median long term debt outstanding by 5.4%.
Airports exhibited the second biggest reduction in their median long term debt outstanding with a -9.3% decline.
Among the governmental sectors, state governments expanded the most with a median outstanding total tax supported direct debt load of 42.5% growth. In contrast, counties downsized their outstanding direct debt by a relatively conservative median change rate of 2.9% during the period from 2007 to 2017. Cities saw their direct debt loads grow higher, but by a more modest 6.2% expansion.
Municipal Bond Credit Sectors — Five Year Debt Outstanding Trend
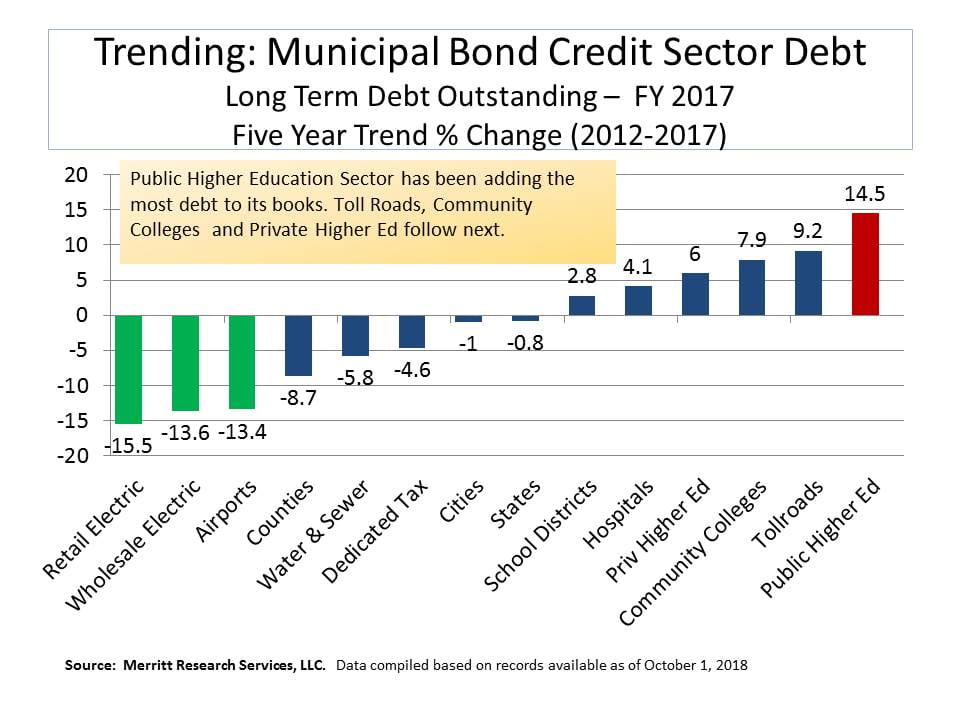
Over a more recent five year trend (2012 to 2017) paralleling the post-recession recovery period, a similar allignment among the major municipal bond credit sectors stayed intact; however, a significantly more conservative debt expansion pace was evident. Public Higher Education still led other credit sectors with a 14.5% increase in debt outstanding while community colleges showed the third highest increase at 7.9%. Tollroads took second place due in large part to lower political resistance to issue non-tax related debt paid from tolls in order to finance highwary projects. The two public power sectors as well as airports saw long term debt levels decline with median debt loads falling at double digit rates. Counties showed the most conservative profile among government types with a five year median direct debt contraction of -8.7%. Governments in general showed a lower appetite for debt during the period.
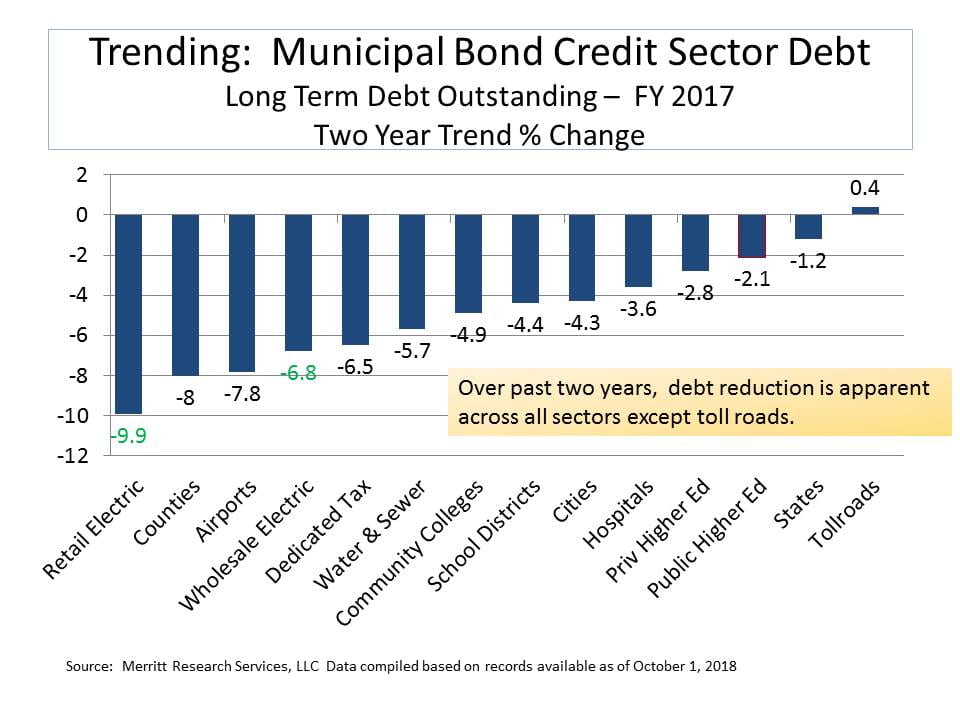
Municipal Bond Credit Sectors — Two Year Debt Trend
With the economy clearly in recovery since 2015, the case for borrowing at historically low interest rates to address much needed infrastructure would suggest that public sector and non-profit organizations would be tackling capital improvements by adding debt to their balance sheets. That’s far from the case as evidenced by debt figures from 2015 to 2017 financial statements. Subdued in part by a more conservative bent to incur debt, but also by the sharp uptick in contributions to pay pension requirements among government related sectors, the median debt load for all sectors declined or was flat over the last two years. Municipal retail electric utilites fell the most with a 10% cut. Counties lowered their debt levels by 8%. Even higher education institutions which have been increasing their debt over the past five and ten years have diminished their appetites more recently. Tollroads were the sole exception to the debt declines with a small gain of less than 1%.
Municipal Bond Credit Sectors — Two Year Total Liabilities Trend
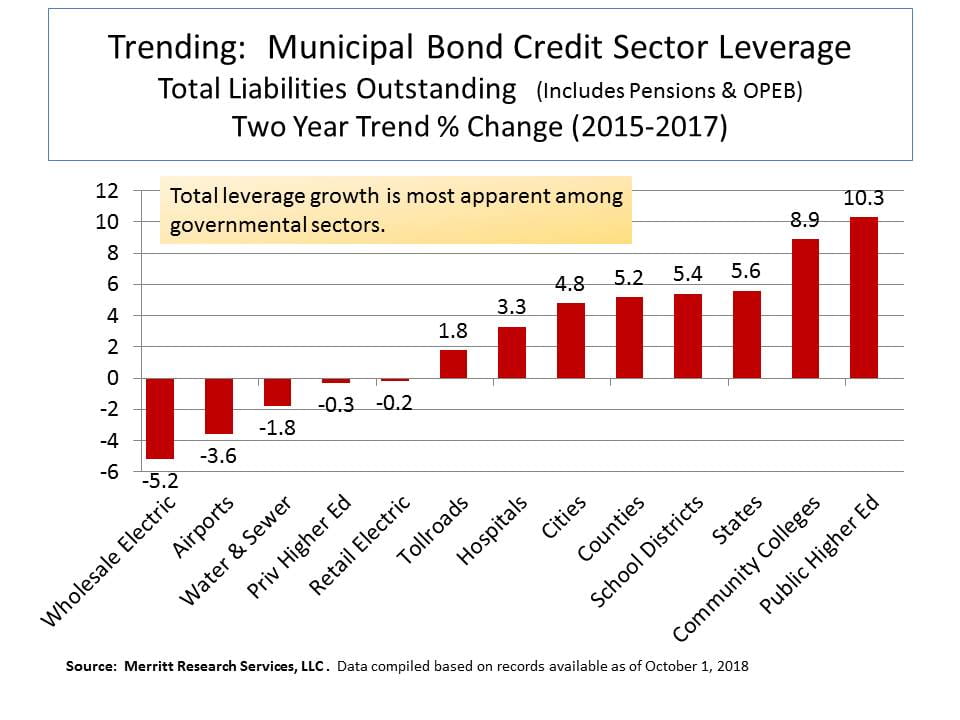
Although debt levels for the past two years have been on the decline, the median growth in total liabilities for municipal bond credit sectors has not. Total liabilities, which includes total debt outstanding net of fixed assets, unfunded pensions, OPEB and all other liabilities showed a relatively steep rise in total liabilities, with public higher education and governmental borrowers growing the total amount that they owe by the fastest expansion rates. Since the new GASB rules 67 and 68 went into effect for the 2015 fiscal years, the two year totals reflect a consistent, more complete accounting of unfunded pensions. A similar GASB accounting change applying to OPEB liabilities will begin to show up in the FY 2018 numbers, which should add to the liability levels for governements even more. It might surprise some that public higher education and community college liabilities outpaced states and other governmental bodies since public pensions are not usually associated with them. However, these institutions do indeed carry their own share of pension responsibilities. That burden is frequently reflected in their participation in multi-employer government cost-sharing pension plans. When their share of pension liabilities are combined with their debts outstanding, they stand out. Perhaps in aggregate, the sector that will be bearing the most weight of all of these burdens is the states since they have either a direct or indirect fiscal relationship or responsibility with every one of the five sectors that marked the biggest increases in liabilities. No doubt, the next recession will test the resiliancy of their interrelationships.
Richard A Ciccarone, Co-Publisher of MuniNet Guide and President of Merritt Research Services, LLC