Approaches to Taxation and Leverage in the Midwest, James Spiotto Addresses Tax Policy in an Ever Changing Economy
In a previous MuniNetGuide article, James Spiotto addressed the demographic, economic, and debt characteristics of Midwest states, providing context for the environment in which policy decisions get made. This presentation is an examination of tax policy today, and forward-looking approaches for tomorrow.
The article will start with a review of the major tax revenue sources in the Midwest States indicating on a comparative basis what specific taxes each state relies on more heavily in relationship to other states in the Midwest. Given the lessons learned from the 1930s Depression on diversity and effectiveness of taxation, the article discusses what should be future taxing sources and policy in light of the digital, artificial intelligence/ automation revolution and the growing shared economy movement. Forward thinking tax policy can make all the difference and is one of the reasons why the diversity of tax sources prevented the Great Recession of 2008 from being the Great Depression.
Tax revenue sources of Midwest states
Tax revenue increases 2000-2015. Seven out of twelve Midwest states had tax revenue increases above the national state average of 79.7%: North Dakota (229.9%), Iowa (217.0%), Kansas (95.0%), Nebraska (89.0%), South Dakota (89.7%), Illinois (83.4%) and Minnesota (80.0%). Wisconsin (45.0%) and Michigan (26.3%) had tax revenue growth under 50% for the same period.

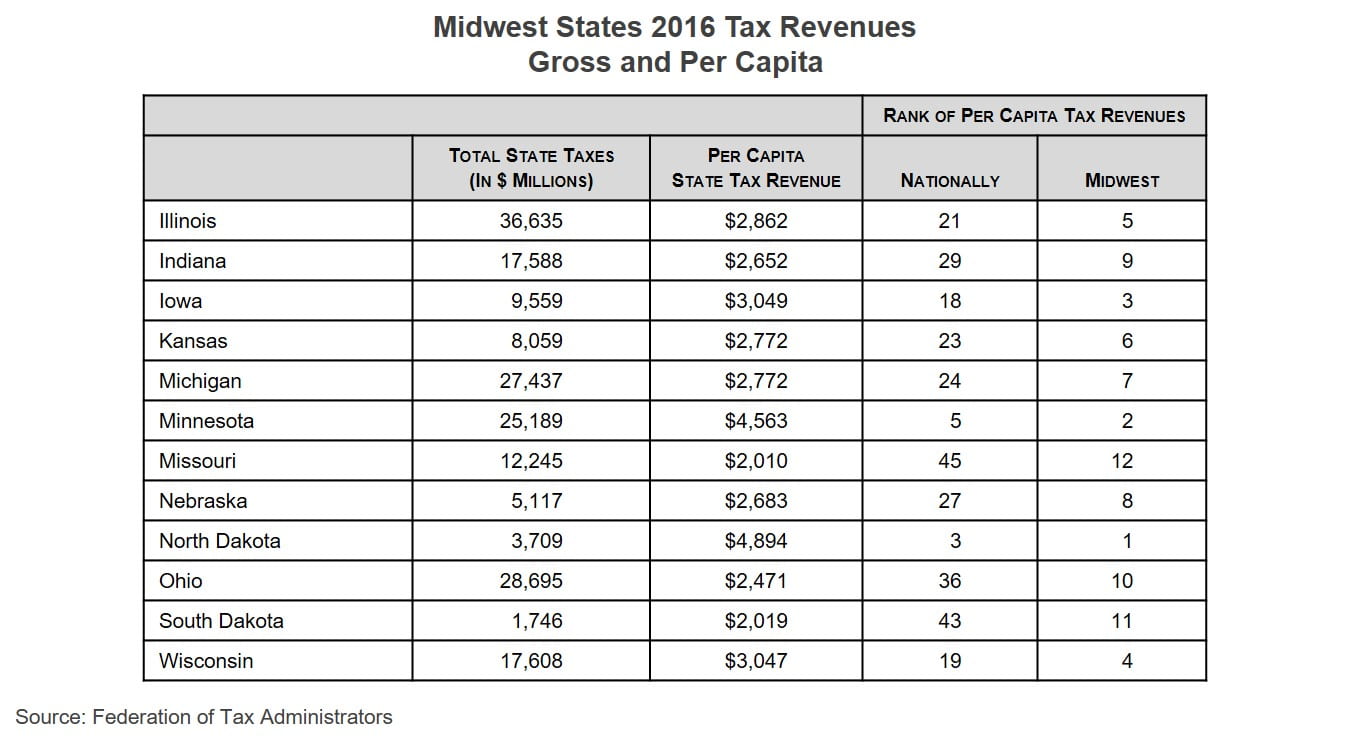
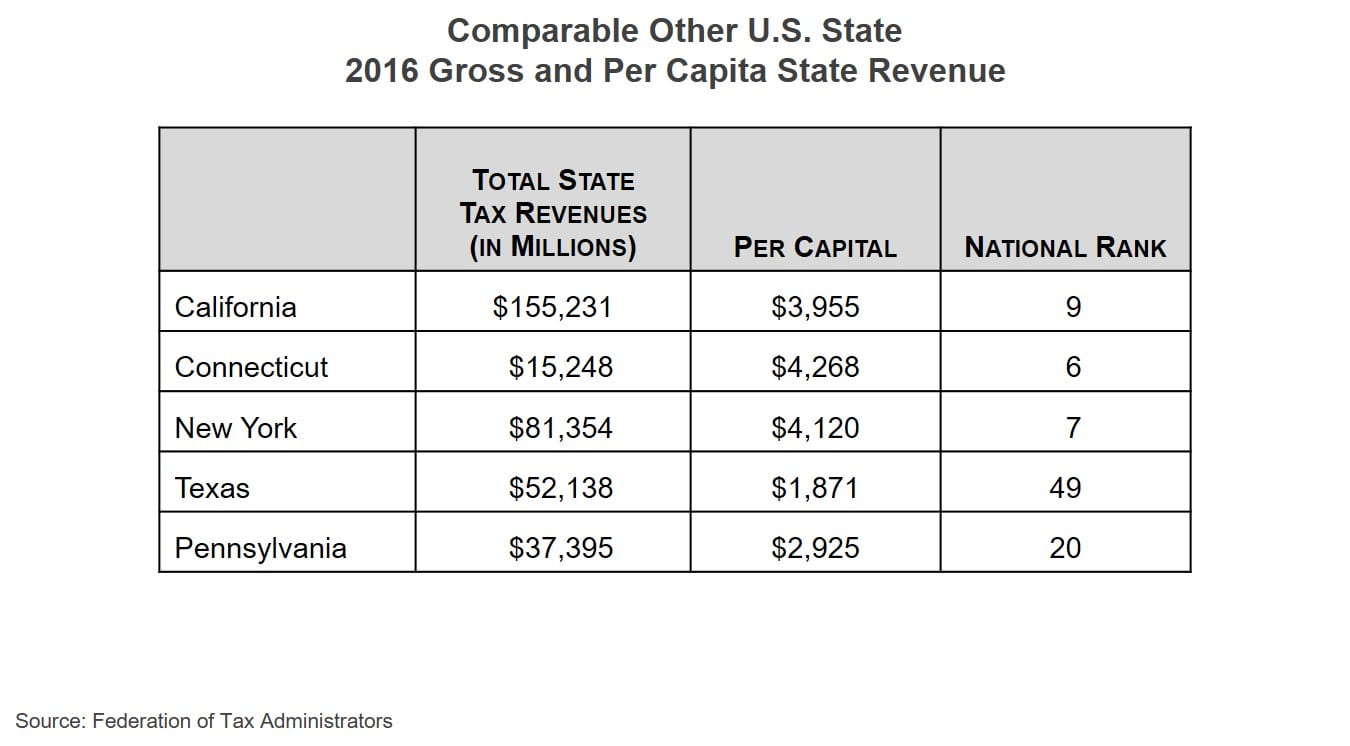
State revenues, gross and per capita, 2016. With the exception of North Dakota (3) and Minnesota (5), Midwest states ranked between 18-45 nationally in terms of tax revenue per capita in 2016. Most of the Midwest states are in the middle of the range of per capita tax revenues, with eight out of twelve Midwest states are in the top half of all U.S. states. There are three comparable states outside the Midwest that are in the top ten highest tax revenues per capita: Connecticut, New York, and California.
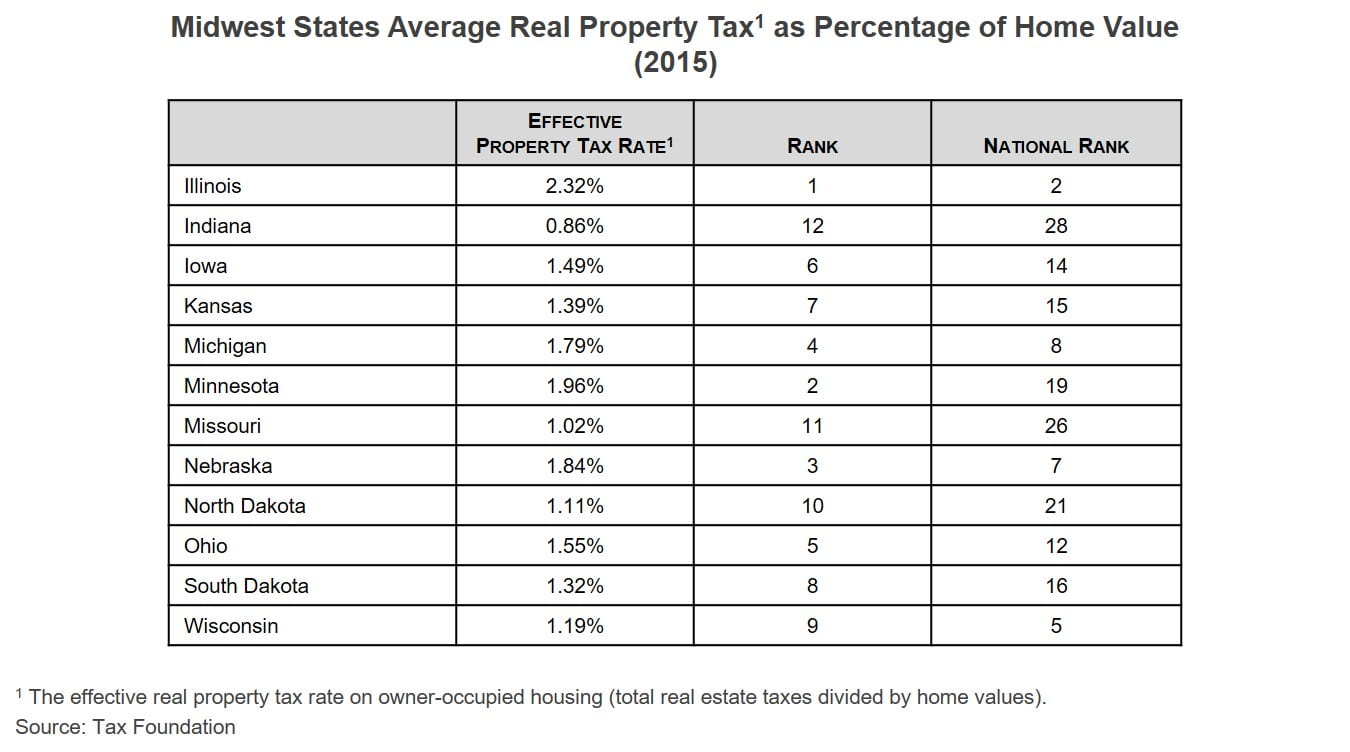
Effective property tax rates for Midwest states, in general, are higher than U.S. states average by national rank. Two Midwestern states rank in the top five for effective property tax rate, Illinois (2) and Wisconsin (5). All but one of the Midwestern states rank in the top half of states by effective tax rate in 2015. The one exception was Indiana (28).

Individual income tax rates for Midwestern states and other comparable states. The top income tax rate Midwestern states range from 2.9% to 9.85%, with no income tax for South Dakota.
Of the eleven Midwestern states that have a stat income tax, three (Illinois, Indiana and Michigan) have a fixed rate and the eight a graduated rate. Compared to other non-Midwest states, California has the highest tax rate, with a top rate of 13.3%, (9.3% at taxable income of $100,000). Texas, Nevada, South Dakota, Wyoming and Washington have no income tax.

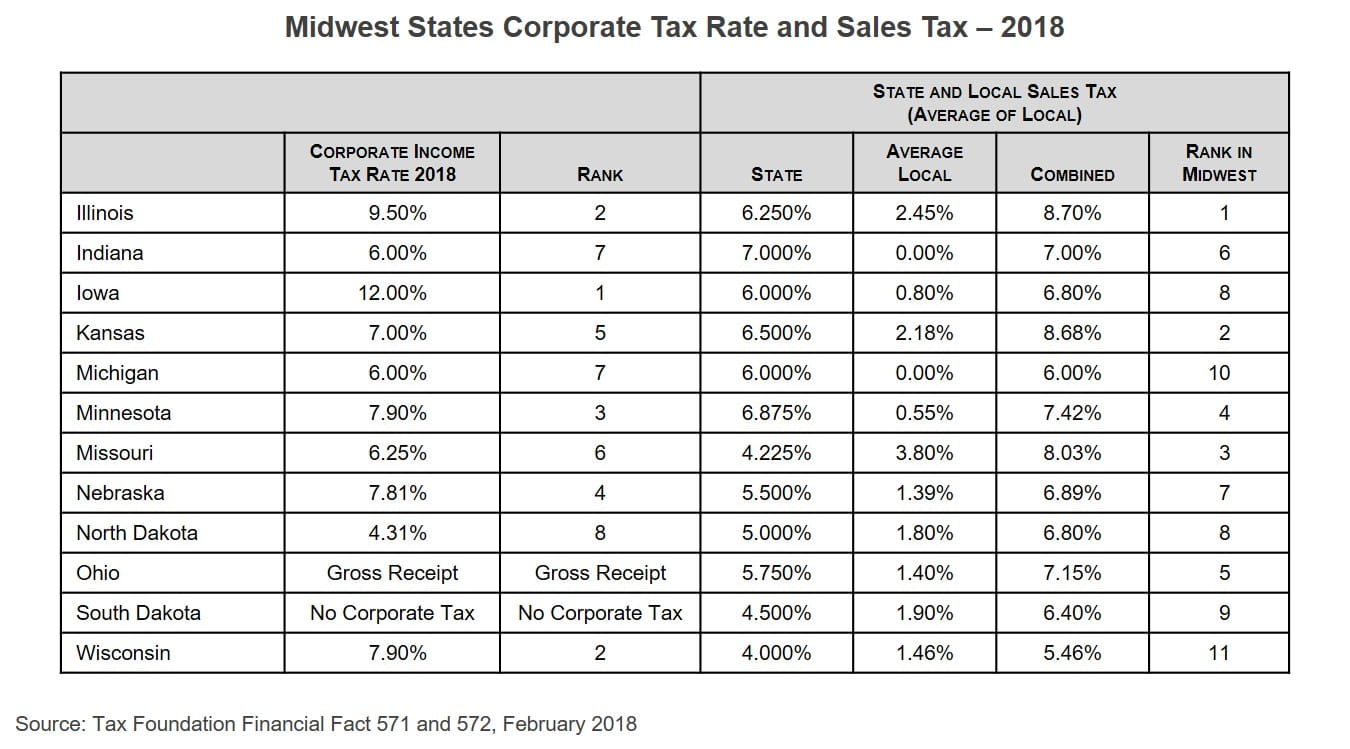
Corporate tax rates Midwest states in 2018. The range for corporate tax rates for Midwest states as of 2018 is 4.31%-12.00%. South Dakota and Ohio have no corporate income tax (but Ohio has a gross receipt tax). Obviously the ability to attract new businesses and to have current businesses expand has some relationship to corporate tax rates. The top three corporate rates in the Midwest are Iowa (12.0%), Illinois (9.5%), and Minnesota (7.9%).
Sales tax rates for Midwest states. State and local sales tax in the Midwest ranges from a combined 5.46% to 8.70% based on the average local sales tax. In Illinois, the sales tax number is based on the average for local government, and the effective highest sale tax rate is Chicago at 10.25%.

Will digital and shared economy revolution threaten traditional tax revenues sources mandating changes in tax policy and focus:
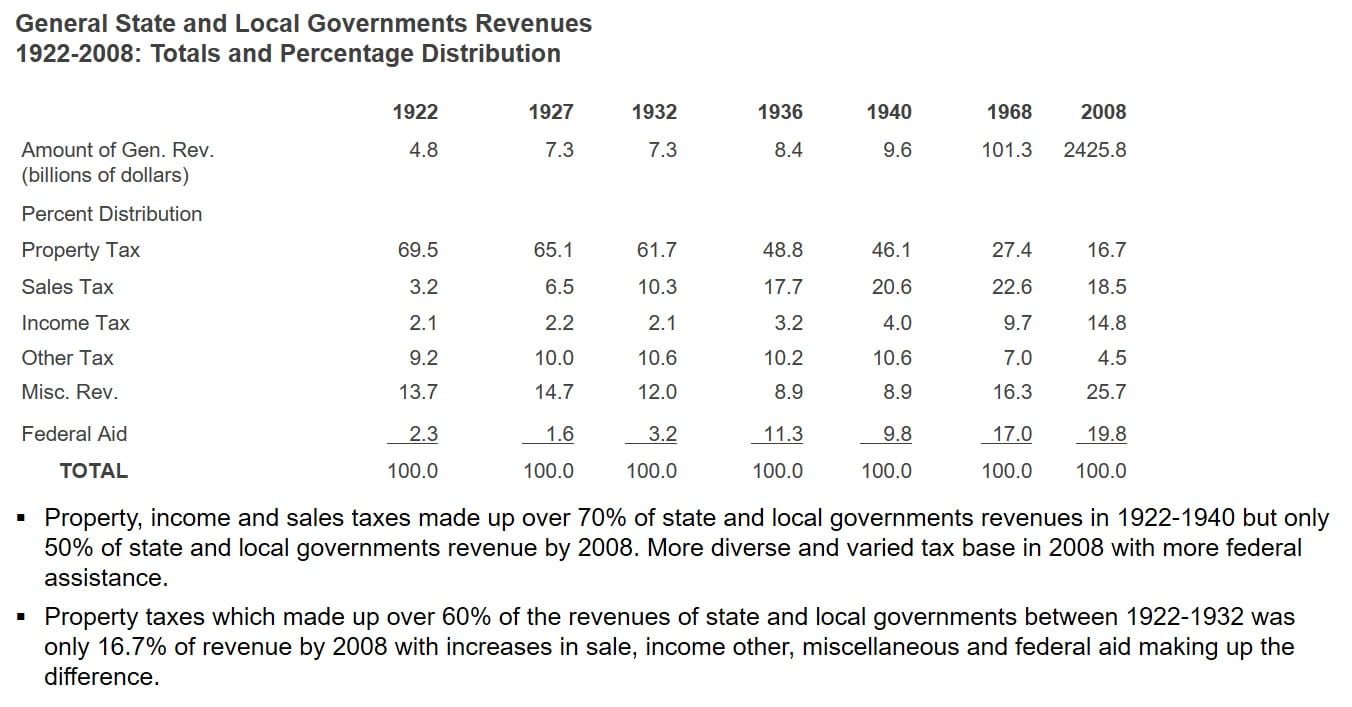
Diversification of tax sources to prevent over-concentration of source of funding: Since the Depression of the 1930’s, state and local governments have diversified the source of tax revenues to reduce reliance on property taxes, to spread the burdens and reduce the risk of concentration. That diversity of tax sources has made a real difference in the eleven economic downturns since 1949, especially in 2008.
But will this diversity of tax sources and strength of tax revenues and collections be true for the foreseeable future?
Not necessarily!
The digital, shared economy and artificial intelligence (automation) revolution has put the strength of diverse tax revenue sources into question:
Online sales. Increased online sales will threaten traditional sale tax receipts and, as online sales increase and the sale tax revenues are not collected or not collected in the jurisdiction the purchaser resides, there will be a loss of sale tax revenue from the traditional sale tax government tax collector. Amazon Distribution Centers are not located in major metropolitan areas where the bulk of the Amazon purchasers reside. The U.S. Government Accountability Office estimates the loss of sales tax revenues due to online sales to be $8 billion to $13 billion in 2017 while the National Conference of State Legislatures and International Council of Shopping Centers estimated the sales tax loss to the states in 2015 to be $26 billion.
Autonomous electric cars by 2026. California Department of Transportation predicts major highways in California may well be, by 2026, restricted to electric level IV autonomous cars. What will happen to gas tax revenues and related bond issues, or employees in manufacturing of combustion engines, vehicles and related fields, e.g., car repairs or sales? What will be the effect of the probable reduction of employed workers in related fields of oil and gas, refineries, auto and auto parts, manufacturing for combustion engines, vehicles and machines, auto repairs, etc., which is estimated to decrease 20-30% each year after 2025, and the resulting loss of those workers’ income tax and sale tax revenues and increase in unemployment benefits?
Shared economy. With autonomous electric cars used by Uber and Lyft, and the reduction or virtual elimination of private ownership of vehicles, what is the result in lost parking lot tax revenues (since cars do not park all day due to constant use and little individual ownership), loss of employment for parking lot servicing employees and related loss of income tax revenues as well as reduced number of vehicles needed due to the “more efficient use of vehicles by reduced individual ownership”? Also, various equipment used occasionally in home ownership will not need to be purchased individually but will be shared on a collective “rent” or “ownership” basis. Possible significant decrease of taxi fees, traffic violation fines, parking taxes, vehicle registration fees and toll road collections, etc. In addition, Turo allows individual car owners to rent their cars to the public as part of the shared economy.
Expanded use of automation and artificial intelligence. As automation continues to evolve and workers are replaced by robots, what should be the replacement tax on robots, the cost of out-of-work workers, the lost income and lost sales tax revenues from personal consumption of goods and services? Should there be a robot replacement tax to capture all the lost revenues?
The increased use of Airbnb. With the Airbnb phenomenon, there will be loss of local hotel and convention taxes, loss of jobs in the hotel industry and possible lack of safety standards for vacation and visitor guest rooms. Most major cities, as well as smaller ones, have made budgets balance and needed capital improvement projects funded by a hotel and convention tax. Those taxes will be difficult to collect, enforce and levy on individual home and apartment owners in this yet to be regulated cottage industry.
Use of debt limitation and tax limitation:
- Virtually all states impose some sort of limitation on the amount of debt or tax limitations or both. (See Appendix I taken from the recently released Second Edition of “Municipalities in Distress? How States and Investors Deal with Local government Financial Emergencies”).
- Municipal debt limits range from a percentage of a valuation of assessed property to a monetary amount. Will these limits be appropriate and effective given the effects of the digital, shared economy and artificial intelligence revolution?
- States handle debt for essential services differently than for non-essential.
- There have been recent attempts in some states to tighten local debt limits while others strengthen protections.
- Generally, revenue bonds paid from the revenues of a municipal enterprise (water, sewer, bridge, tollway, electric system) are exempt from debt limits. So also are tax increment financing and appropriation bonds.
- With unresolved obligation for public workers’ unfunded pension and health care costs, as well as growing deferred needed infrastructure improvement costs, at the same time there are decreasing tax revenues compared to traditional revenue source, statutory and constitutional debt and tax limits may need to be increased. What are the good as gold tax revenues that will remain and what new ones need to be developed to avoid increasing tax and debt limits.
- Refunding bonds are permitted in all states. But, if the sources of tax revenues are drastically changed by the effects of digital, shared economy and artificial intelligence implementation, what will be the new assured tax revenues of the future?
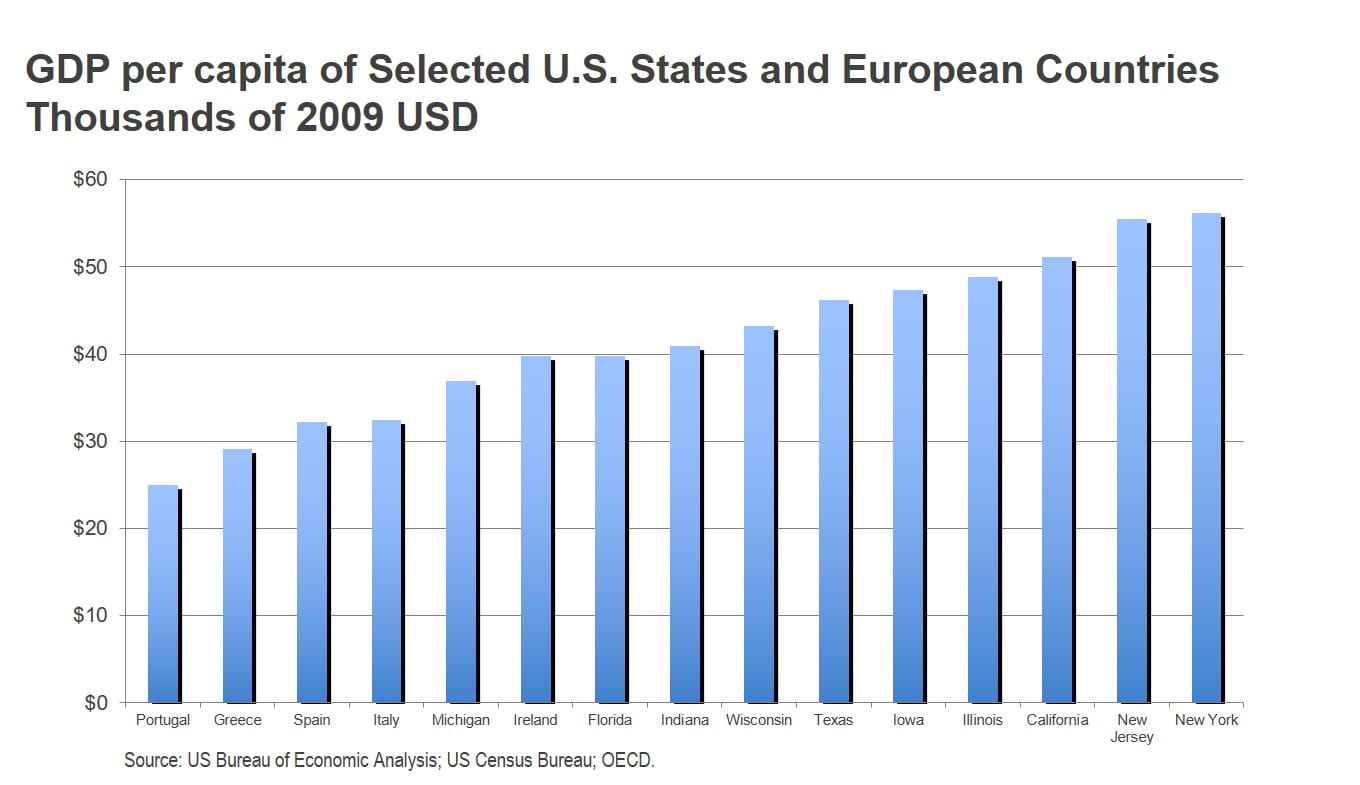
- Our states and municipalities enjoy favorable GDP per capita, debt to GDP, and debt to revenue ratios compared to other sovereigns on a global basis:
- The per capita GDP of each of California, Texas, Florida, New York, Illinois and New Jersey (certain “Major U.S. States”) is higher than Portugal, Greece, Italy and Spain.
- The percentage of debt to revenue ratio is lower for Major U.S. States than Portugal, Italy and Greece.
- The percentage of debt to GDP is lower for certain Major U.S. States than Spain, Ireland, Portugal, Greece and Italy.
- This helped in the last great recession of 2008 but will this still be true in the next economic downturn when GDP may be adversely affected by tariff wars, loss of jobs and lost tax revenue sources due to the digital, shared economy and artificial intelligence revolution?


The most recent example of our states enjoying a favorable GDP and debt to GDP and debt to revenue ratios compared to other sovereigns on a global basis is China, which has:
- –31 provinces and regional governments.
- –391 cities.
- –2,778 counties.
- –33,000 townships.
The combined debt of these local governments is approximately $3 trillion or 36% of China’s GDP (2012) (China National Audit Office). In 2015, China’s debt to GDP was approaching 40% from about 20% in 2007. 99 cities, 195 counties and 3,465 townships in China had direct debt in 2013 exceeding 100% of their respective annual economic output (GDP). Interestingly, the central government in China is stepping up to help “refinance” the local government debt purchasing (exchanging) local debt by the central bank thereby lowering by 3-4% annually the borrowing cost from 500 basis points plus over treasuries.
Comparatively, the USA has:
- –31 provinces and regional governments.
- –3,031 counties.
- –19,522 municipalities.
- –16,364 townships.
- –37,203 special districts.
- 12,884 independent school districts.
The combined debt of state and local governments is approximately $3 trillion (Federal Reserve Bank of St. Louis 2013) or 18.52% of the USA’s GDP. The highest percentage of debt to GDP for any state and its local government is approximately 24.53% for Kansas, and 22.06% for New York with the lowest being Wyoming at 5.25%. The percentage of debt to local GDP for large city issuers in the USA is generally less than 20% and in most instances less than 10%. However, given tariff wars, failed trade negotiations and economic shifts due to trade imbalances, the favorable U.S. comparison to China could change more rapidly than expected.
The need to reexamine the future viability of current tax revenue sources and consider new policies and sources for taxes to survive the digital, shared economy and artificial intelligence revolution:
Threat to current financings. If there will be autonomous cars, use of shared economy rooms in apartments and homes and not continued use of hotels, then there will be less use of hotels, cars, parking garages, etc. The future of current financings that have 10-20 years to maturity relying on such taxes on hotel, parking, gas, etc., as repayment sources will be a challenged.
The viability and sufficiency of tax sources and general tax policy will need to be examined and refined to meet the challenges of the digital/automation/shared new reality.
Is it too late to start or too early? An analysis of the long-term sufficiency of current source of tax revenues can never begin too early or start too late. Based on the lesson of the 1930’s Depression, if the tax revenue source is the subject of a major change, those financings and funding targets need to be correspondingly modified to deal with the evolving flow of possible tax revenues.
Whether there will be an automation tax or robot tax to cover lost tax revenues of displaced unemployed workers or a value-added tax for increased manufacturing productivity due to automation or other new tax formulae or methods of taxing will be the subject of spirited debate and experiment.
James Spiotto