James Spiotto Looks at Approaches to Taxation and Leverage in the Midwest, Starting With Recent Regional Demographic, Economic, and Debt Characteristics
This article is Part I of a series of looking at approaches state and local governments Midwest could take to tax and debt policy. Future articles will focus on current the viability of current revenue sources, what revenue sources are newly available and may emerge in the future, tax policy as a tool of economic development, risk perception of state and local government debt, and de-annexation. Part I focuses on getting the lay of the land by reviewing recent state demographic, economic, and debt profiles.
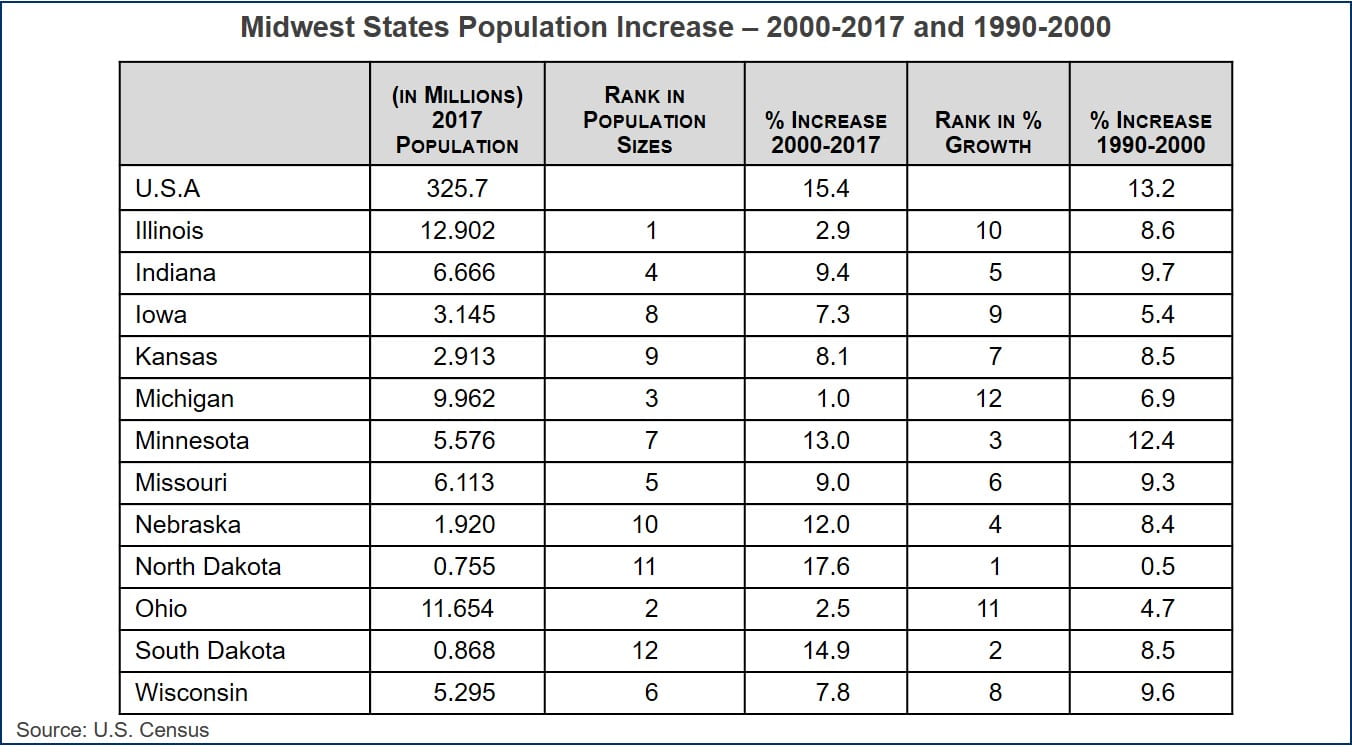
Population growth of Midwest states and the U.S. Since 1990
The U.S. between 2000 and 2017 experienced population growth of 15.4% to 325.7 million. Generally, the Midwest region has lagged behind. North Dakota, with a growth rate of 17.6% since 200, is the only state in the Midwest Region to outpace the national growth rate.
Only four states in the Midwest grew over 10% between 2000 and 2017, namely: North Dakota (17.6%), South Dakota (14.9%), Minnesota (13%) and Nebraska (12%). Another five states in the Midwest grew between 5-10% during the period of 2000 and 2017: Indiana (9.4%), Missouri (9%), Kansas (8.1%), Wisconsin (7.8%) and Iowa (7.3%). Three of the Midwest states grew less than 5% between 2000 and 2017: Illinois (2.9%), Ohio (2.5%) and Michigan (1%). This is less than 20% of the U.S. average population growth rate for the period.
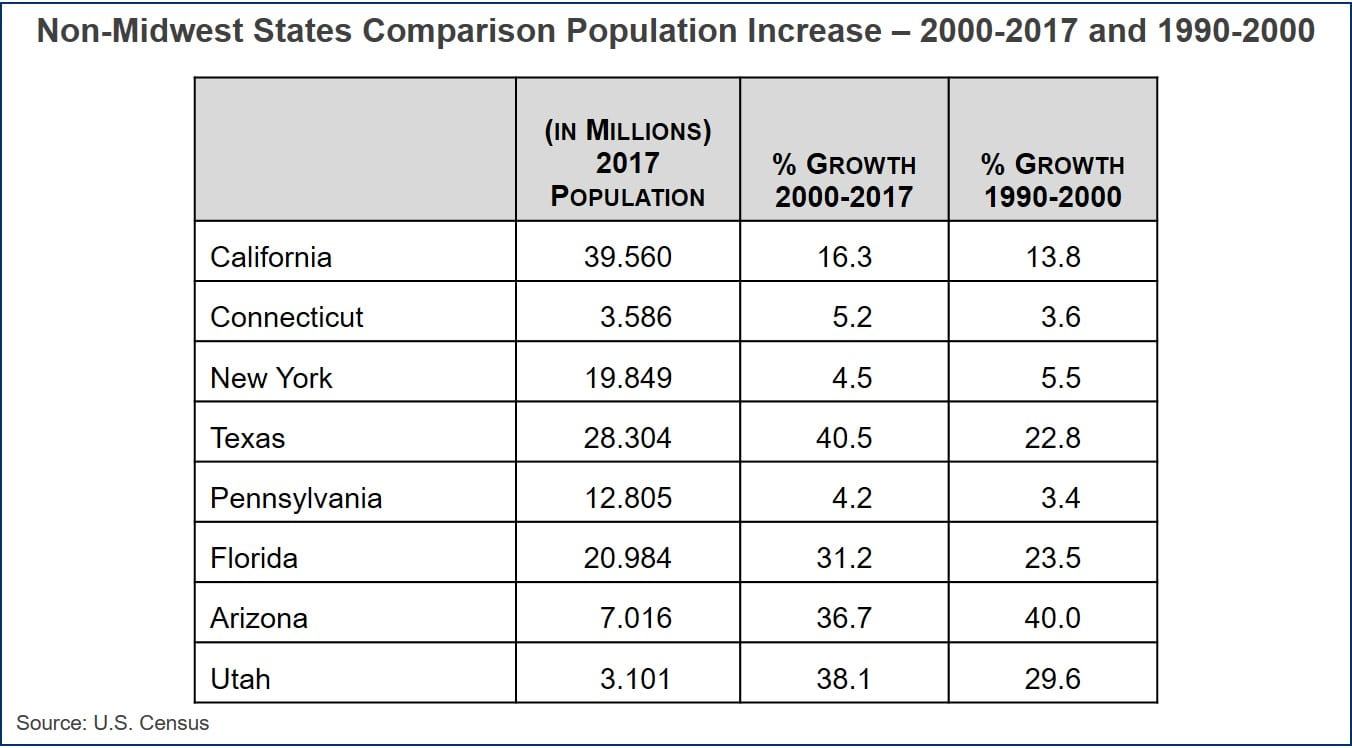
Other non-Midwest states greatly surpassed the growth rates of the region, such as Texas (40.5%), Utah (38.1%), Florida (31.2%) and Arizona (36.7%).
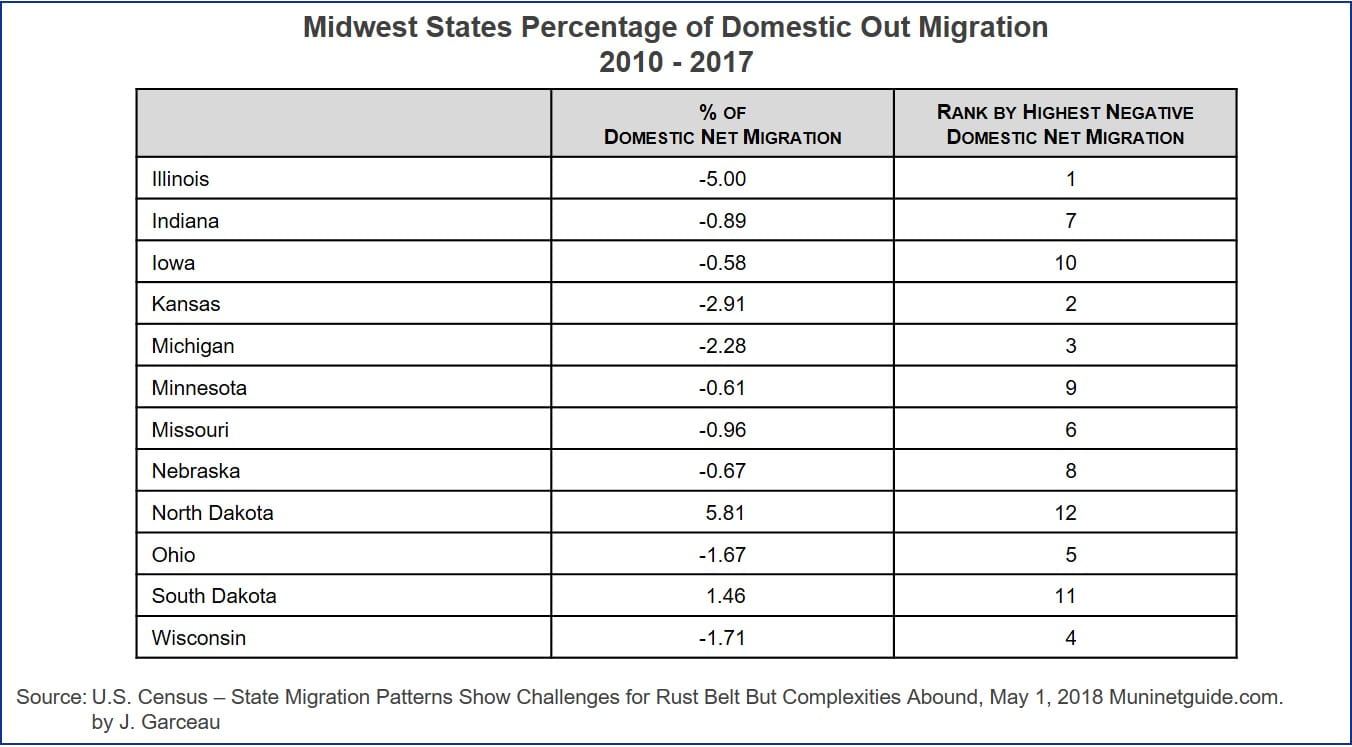
Between 1990 and 2000, the U.S. population grew by 13.2% but no Midwest state equaled or exceeded that percentage. The highest was Minnesota at 12.4% followed by Wisconsin at 9.6%, Indiana at 9.7%, Missouri at 9.3% and Illinois at 8.6%. With the exception of North Dakota and South Dakota, the Midwest states had negative net domestic migration, where more people migrated out of the state than migrated in, with Illinois, Kansas, Michigan and Wisconsin leading the way in loss in domestic migration.
Employment and unemployment in Midwest states compared to U.S. average
Between March 2010 and March 2018, the number of non-farm wage and salary employment (workers) increased on average in the U.S. by 14.2%. Once again, only North Dakota (14.8%) equaled or surpassed the national rate. Only five out of twelve Midwest states had increases in workers employed between March 2010 and March 2018 by more than 10%: North Dakota (14.8%), Michigan (13.8%), Indiana (12.5%), Minnesota (12.3%) and Ohio (11.3)%.
 During the same time period, March 2010 to March 2018, the U.S. unemployment percentage went from 9.9% to 4.1%, for a percentage of unemployment reduction of 58.6%. Unemployment is one area where the Midwest compares favorable to the national average, as six of the twelve Midwest states had a larger percentage of unemployment reduction than the U.S.: Wisconsin at 68.2%, Michigan at 65.2%, Illinois at 63.9%, Missouri at 62.9%, Ohio at 59.7% and Indiana at 58.9%.

Midwestern states GDP and increase in GDP since 2008 and 2000 compared to U.S. combined
The U.S. Gross Domestic Product in current dollars all industries (“GDP”) in 2017 was $19.263 trillion and it increased since 2000 by 88.5% and since 2008 by 31.7%. Only four Midwest states had a GDP increase equal or more than the U.S. combined GDP increase between 2000 and 2017, namely: North Dakota (209.4%), Nebraska (112.7%), South Dakota (108.7%) and Iowa (110.7%). Seven Midwestern states had a GDP increase between 2000 and 2017 of over 50%, but less than 88.5% U.S. combined, namely: Minnesota (83.7%), Kansas (81.6%), Wisconsin (78.0%), Indiana (74.8%), Illinois (66.8%), Ohio (64.2%) and Missouri (61.2%). Only one state had a GDP increase between 2000 and 2017 of less than 50%, namely Michigan at 43.6%.

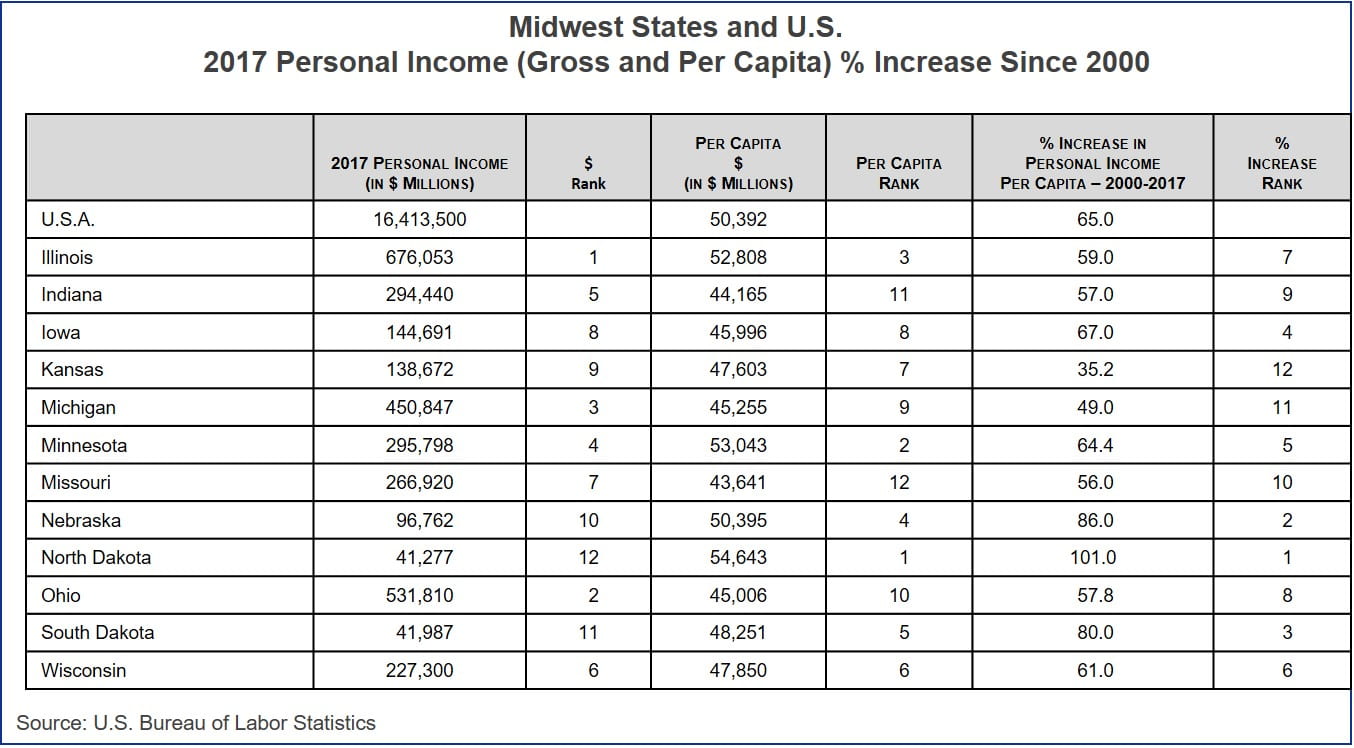
Midwest states comparison of personal income (per capita income) and percentage increase since 2000 compared to U.S. average
Only four Midwestern states had an increase in per capita personal income equal or greater than the U.S. average between 2000 and 2017 of 65%: North Dakota (101%), South Dakota (80%), Nebraska (86%) and Iowa (67%). Six Midwestern states had an increase in per capita personal income between 2000 and 2017 of over 50% but less than 65%: Minnesota (64.4%), Wisconsin (61.0%), Illinois (59.0%), Ohio (57.8%), Indiana (57.0%) and Missouri (56.0%). Two Midwestern states had a per capita personal income increase between 2000 and 2017 of less than 50%: Michigan (49.0%) and Kansas (35.2%).
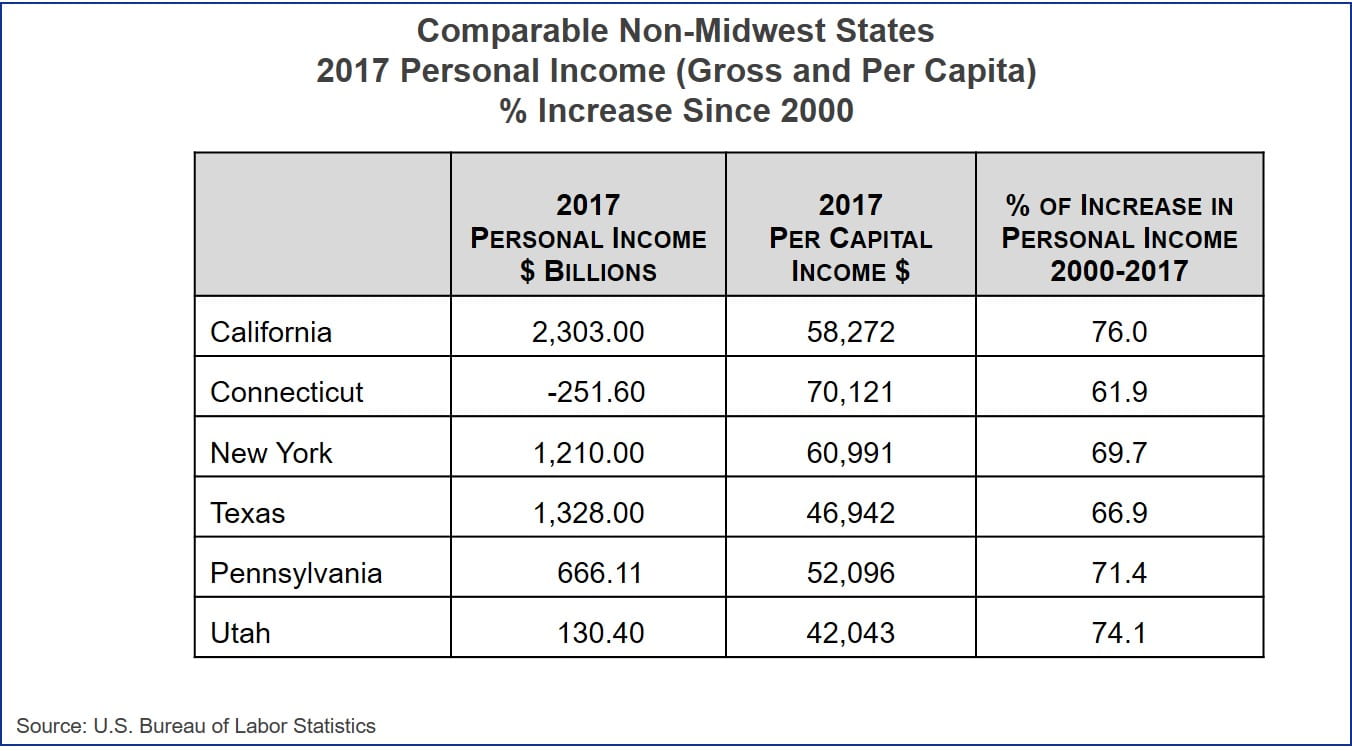
 The non-Midwestern states had many examples increases in per capita personal income between 2000-2017 exceeding the U.S. combined average of 65%, naemly: California (76.0%), New York (69.7%), Texas (66.8%), Utah (74.1%), and Pennsylvania (71.4%).
Midwestern states comparison of unfunded public pension liabilities and funded ratio for 2016 and other state comparables
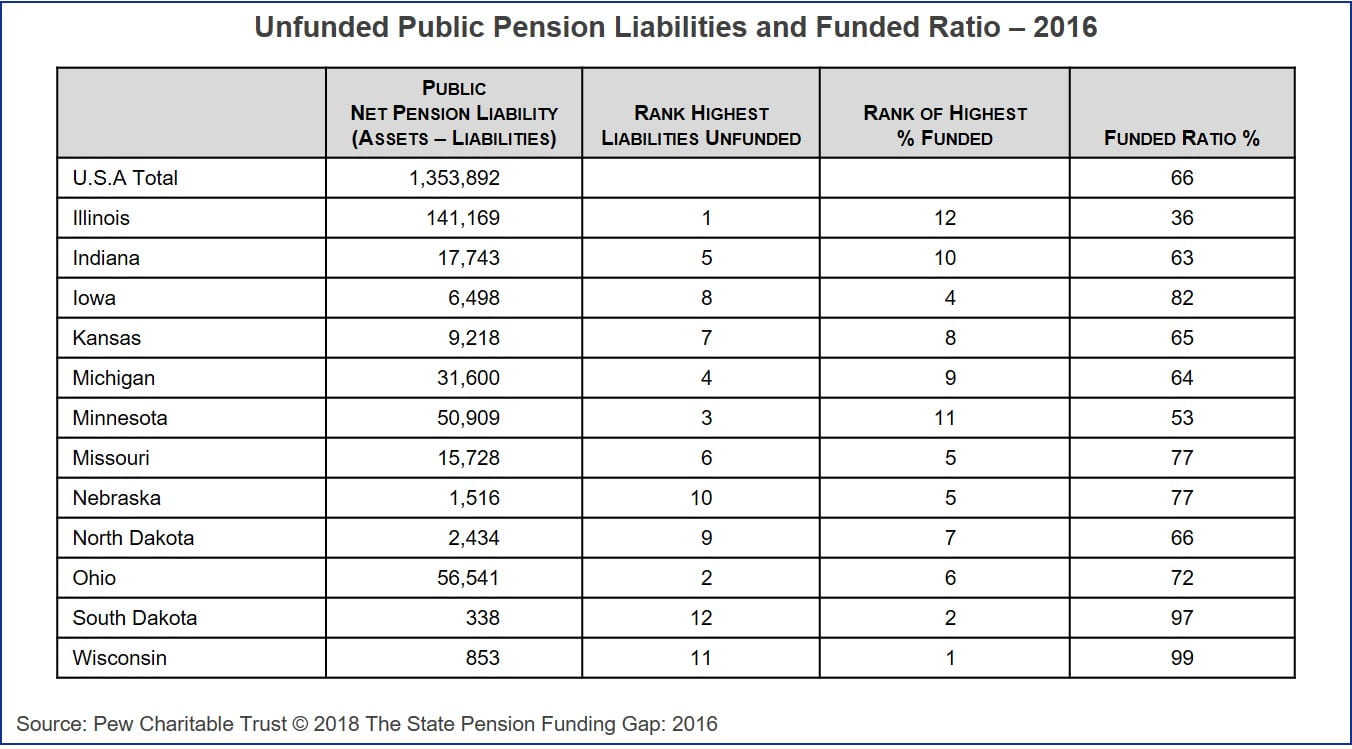
The U.S. average for state public pension funds funded ratio is 66%, and there are seven Midwest states that equal or exceed that: Wisconsin (99%), South Dakota (97%), Nebraska (89%), Iowa (82%), Missouri (77%), Ohio (72%) and North Dakota (66%). There are five Midwest states that have funding ratios below the national average: Kansas (65%), Michigan (64%), Indiana (63%), Minnesota (53%) and Illinois (36%).
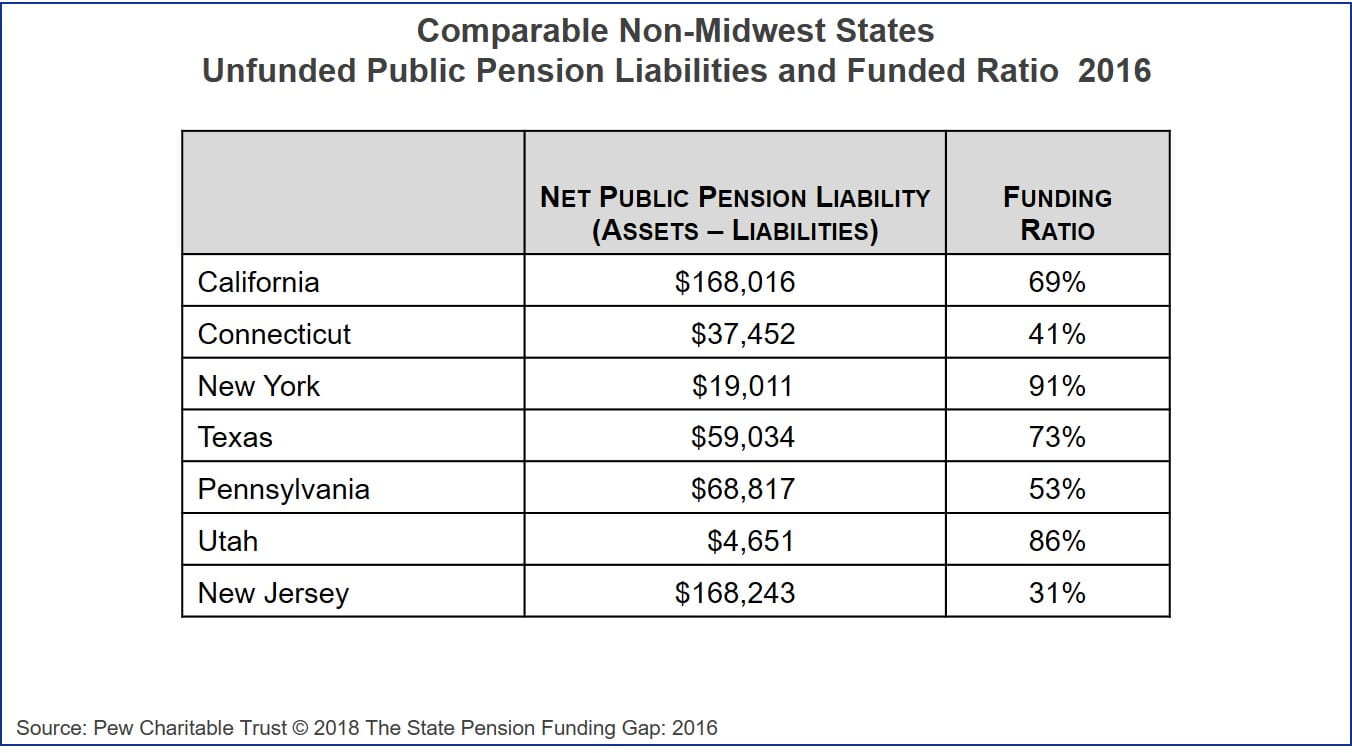
 Other states that have been used as points of comparison demonstrate the similar range of funding levels, namely: New York (91%), Utah (86%), Texas (73%), California (69%), Pennsylvania (53%), Connecticut (41%) and New Jersey (31%).
Only three Midwestern states have state and local debt as a percentage of GDP greater than the average for the combined U.S. state and local debt as percentage of GDP
The average of U.S. states and local debt as a percentage of GDP is 15.6% and the Midwest compares favorably, with only three Midwestern states having a percentage of debt to GDP that is higher: Kansas (24.5%), Illinois (18.8%) and North Dakota (15.7%).
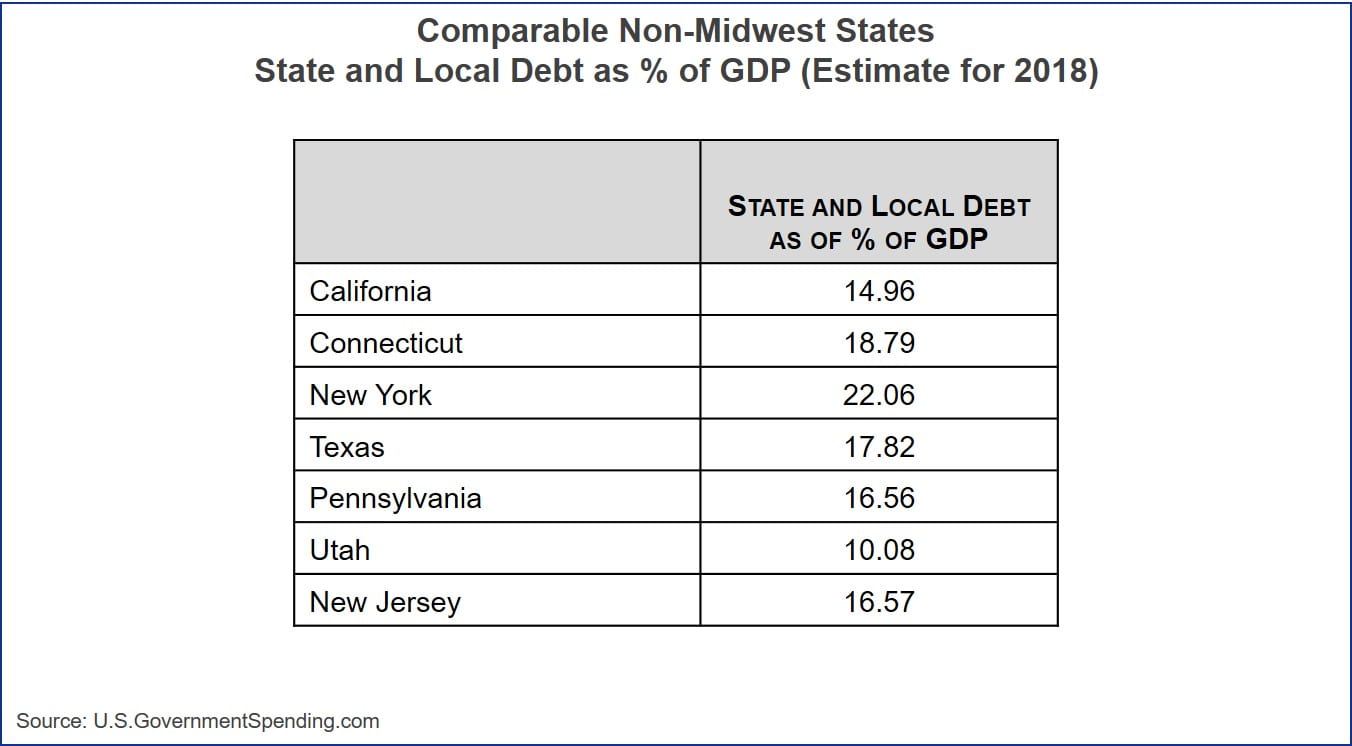
Other non-Midwest state that have been referred to demonstrate similar range of debt as a percentage of GDP, with only two states below the U.S. state average, namely California (15%) and Utah (10.1%), with others above the national average: New York (22.1%), Connecticut (18.8%), Texas (17.8%), Pennsylvania (16.6%) and New Jersey (16.6%).
Summary of analysis of economic and debt factors
Slower population growth in Midwestern states, in part due to more domestic move outs than move ins. Generally, Midwest states’ population has grown at a slower pace than the U.S. state average with three states’ population growing less than 20% of the U.S. average: Illinois, Ohio and Michigan. With the exception of North Dakota and South Dakota, the Midwest states had negative net domestic migration (more move outs than move ins).
Slower employment growth in Midwestern states for last eight years compared to U.S. average but generally average reduction in unemployment. Employment in the Midwest states grew more slowly between March 2010 and March 2018 than the average for U.S. states, with one state about equal to the average of 14.2% and five states between 14.5% and 10.0%. The remaining Midwest states were below 10% growth in employment during that period.
Larger reduction of unemployed rates for Midwest states. At the same time during the same period of March 2010 to March 2018, six out of twelve Midwest states had their unemployment rate reduced greater than the U.S. average of 58.6%.
Slower GDP increase for Midwestern states than U.S. average for all states. Between 2008 and 2017, four Midwestern states had a GDP increase greater than the U.S. average for all the states and all but one had a GDP increase for the period of greater than 50%.
Slower personal income increase. Between 2000-2017, per capita personal income for ten out of twelve Midwestern states increased greater than 50%, but only four Midwest states had per capita personal income increases greater than the U.S. average of 65%.
Pension liability. Seven out of twelve Midwest states had funded ratio greater than U.S. average of 66%, with Wisconsin and North Dakota being virtually fully-funded. However, Illinois was one of the states with the largest unfunded pension liability by dollar and one of the lowest funded ratios nationally.
State and local government debt GDP. Only three Midwestern states had debt to GDP percentage lower than the U.S. average of 15.6%
In Part II, we will look at the evolution of taxing policy in the new world of digital, shared economy, and
artificial intelligence.
by James Spiotto