Historically, the use of Chapter 9 bankruptcy by a municipality is still rare, and a last resort. MuniNet Guide’s update on historical and current municipal bankruptcy statistics
We are providing an update on our 2015 piece on municipal bankruptcy statistics. One of the consistent trends that marks Chapter 9 users are small municipal utilities and special purpose districts, or cities, towns, villages, and counties with a relatively small debt profile. Since 1954, virtually all of those cities, towns, villages, and counties that filed Chapter 9 were small or not major issuers of bonded debt, except for Bridgeport, CT in 1991, Orange County in 1994, Vallejo, CA in 2008, Jefferson County, AL in 2011, Stockton and San Bernardino, CA in 2012 and Detroit in 2013. Both Harrisburg, PA and Boise County, ID were dismissed, as was Bridgeport in 1991.
There have been a total of 680 Chapter 9 filings since 1937. Of the 311 Chapter 9 filings since 1980 (and 336 filings since 1954), 181 (196 since 1954) have been municipal utilities and special districts, and only 54 (64 since 1954) have been cities, counties, towns and villages (primary governments). The remainder have been 61 hospitals or healthcare systems, eight transportation authorities, and seven school or educational facilities. Less than 70% of the Chapter 9 filings resulted in a confirmed plan of debt adjustment.

©2018 James E Spiotto and Chapman & Cutler LLP, all rights reserved
No tsunami of Chapter 9 filings from 2012 to 2017, or so far in 2018
Only 13 Chapter 9 filings occurred in 2011, 12 in 2012, eight in 2013, 10 in 2014, and three 2015, six in both 2016 and 2017, and three so far in 2018.
Only four cities, towns, counties or villages filed Chapter 9 (municipal bankruptcy) in 2011, namely Jefferson County, Central Falls, Boise County and Harrisburg, PA (Boise County and Harrisburg were dismissed), 3 in 2012, namely Stockton, San Bernardino and Mammoth Lakes (which was dismissed that year) and only 1 in July, 2013 – namely Detroit. Since the Detroit Chapter 9 was filed in 2013, only one city, Hillview, KY in August 2015, filed for Chapter 9 and that was dismissed in April, 2016 without filing. No other city, town, village, or county has filed Chapter 9 bankruptcy since July 2013.
In the last 60 years, only 64 cities, towns, counties and villages have filed out of 318 Chapter 9 filings that have been made. Twenty-nine of the 64 (44%) were Chapter 9 cases dismissed before any plan of debt adjustment was confirmed; purportedly the city, town, village or county finding a better resolution or was not authorized to file under state laws. (NOTE: Puerto Rico, its instrumentalities, and its public corporations are not included because they are not debtors under Chapter 9 but under Title III of PROMESA, a separate law for U.S. territories.
The largest cities, towns, villages and counties to have filed Chapter 9 bankruptcy in the last 60 years (including Detroit):
| Approximate Population |
Approximate Debt in Millions |
|
| Orange County (filed 1994) | 3,000,000 | $1,974 |
| Vallejo, California (filed 2008) | 115,942 | $175 (2008) |
| Jefferson County (filed 2011) | 658,931 (2011) |
$4,200 |
| Stockton, California (filed 2012) | 291,707 (2010) |
$1,032 (2011) |
| San Bernardino (filed 2012) | 213,012 (2011) |
$492.3 (2011) |
| Detroit, Michigan (filed 2013) | 701,475 (2012) |
$18,500 (2013) |
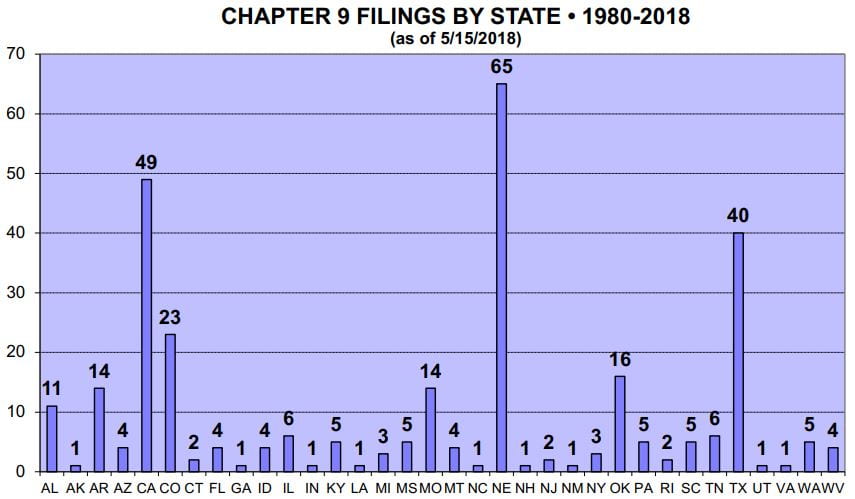
Chapter 9 Filings by State
This chart shows the number of filings in each state over a 38-year period, from 1980-2018. Nebraska leads all states by far with 62, mostly due to filings by Sanitary and Improvement Districts, taxing authorities unique to that state. California (the largest state) and Texas (mainly municipal utility districts) are second and third, with 44 and 38 filings, respectively.
©2018 James E Spiotto and Chapman & Cutler LLP, all rights reserved
Chapter 9 Filings by Type
Since 1980, more than half (58%) of all Chapter 9 filings have been filed by utilities and special districts, while the rest are largely split between primary governments (counties, cities, and villages) and hospital/heath care systems. Few filings have been made by transportation authorities (eight), and schools/education districts (seven).

©2018 James E Spiotto and Chapman & Cutler LLP, all rights reserved
Chapter 9 Filings by Year

©2018 James E Spiotto and Chapman & Cutler LLP, all rights reserved
A spike in Chapter 9 filings by municipal governments occurred in the periods from 1986-1987 and 1991-1994, in part due to the recessions of 1981-1982 and 1990-1991, and filings-per-year stayed elevated before declining from 1995 through 2008. Chapter 9 filings rose again in the years immediately following the Great Recession, but that increase in filings was very modest compared to that experienced in the 1980s and early 1990s. Filings have again declined from 2015 through the present.
The data shows the frequency of Chapter 9 municipal bankruptcy filings is generally rare, and is trending downward. Chapter 9 is and should generally be considered a last resort for governments experiencing fiscal distress.
By James Spiotto, with Jeff Garceau