State Migration Patterns Show Challenges for the Rust Belt, but Complexities Abound
The state of migration patterns in the United States from the Midwest and Northeast to the South and West has been known and discussed for decades, and there are signs that it may be picking up again. However, state migration patterns are more nuanced than a simple emptying out of one region and a filling up of another. Domestic migration patterns, in part retirees moving to warmer climates, are part of the story. International migration and natural population growth provide additional chapters.
Domestic Migration
This map shows the percentage change in total population due to domestic migration to and from a state to other states, from 2010-2017. Domestic migration patterns are what many typically think about when talking about movement between the ‘rust belt’ and the ‘sun belt’, and the data shows just that, as well as growth in the far west (notably, California is an exception in that it has experienced a net loss through domestic migration). New York (-5.3%) and Illinois (-5.0%) saw the greatest reduction in population through domestic out-migration. Movement from north to south in the eastern part of the country was not uniform, as net out-migration occurred in Mississippi (-2.0%) and Louisiana (-1.1%). Florida may be the most often considered state when discussing domestic migrant gains, and while it has seen healthy growth since 2010 (+5.4%), another southern state, South Carolina, experienced even greater gains in percentage terms (+5.7%). North Dakota (+5.8%) and Colorado (+5.5%) also experienced faster population growth through domestic migration.
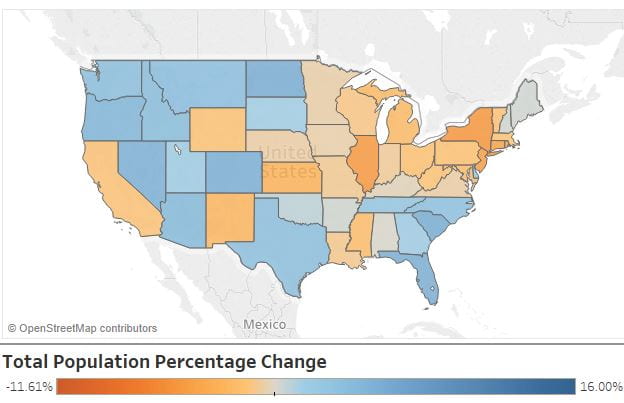
Total Population % Change due to Domestic Migration, 2010-2017. Data via U.S. Census Bureau
International Migration
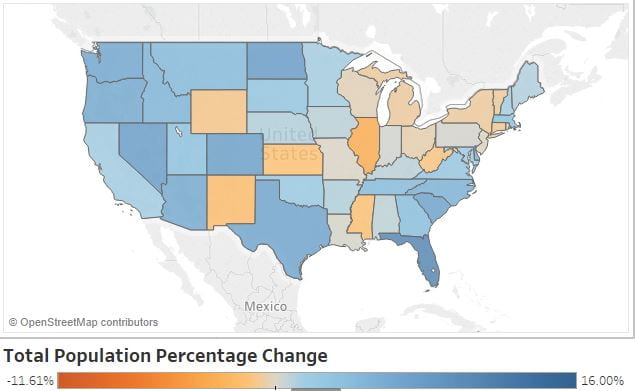
States have experienced universal population growth due to international migration. Florida (+4.8%) leads the nation in population percentage growth since 2010, followed by New York (+4.5%) and Massachusetts (+4.5%). New York had the highest percentage of domestic out-migration, but the second-highest percentage of international in-migration, of all U.S. states. Unlike domestic migration, there is little regional variance in international migration; upper Midwest states like Minnesota (+2.0%) and Rust Belt states like Pennsylvania (+1.9%) have had greater growth rates from international migration than southern states like North Carolina (+1.5%) and Georgia (+1.8%).

State Total Population % Change – Net International Migration – 2010-2017. Data via U.S. Census Bureau
Total Migration Impact
When total domestic and international net migration are collected together, Florida sets the pace, having experienced 10.27% population growth since 2010 due to migration. However, while the Midwest and northeast states trail the net migration rates of southern and western states taken together, most of the states have largely or totally mitigated their domestic out-migration through international in-migration. From Massachusetts, which on net has a healthy +2.9% growth rate, on down to its neighbor Connecticut with a modest growth rate decline of -0.9%, the one stand out among northern states is Illinois, which has the largest out-migration rate of all states in the U.S. (-3.3%).
Total Population % Change – Total Net Migration – 2010-2017. Data via U.S. Census Bureau
Impacts
Domestic out migration can have a negative economic and fiscal impact for states, while in migration is a boon. It should be noted that net migration and and economic prosperity is a ‘chicken or the egg’ situation, where economic prospects largely influence decisions to move to or from a state, while net migration mitigates or exacerbates current conditions. International in migration may in some cases initially be a net fiscal cost, but in the long run, international immigrants typically have a positive economic impact on the states in which they settle. Further, states like New York and Illinois, with high domestic out-migration, have experienced solid natural population increases (births-deaths), both north of 3% since 2010, further balancing out domestic out-migration.
The interactive map below allows you to view state migration patterns for 2010-2017 and one-year 2016-2017 based on domestic migration, international migration, total migration, natural growth, and total growth. The full data set is below.
| State | Total Population Change – 2010-2017 | Natural Increase (Births-Deaths) – 2010-2017 | Total Net Migration – 2010-2017 | International Net Migration – 2010-2017 | Domestic Net Migration – 2010-2017 |
| Alabama | 1.98% | 1.29% | 0.69% | 0.67% | 0.02% |
| Alaska | 4.14% | 7.28% | -3.23% | 2.02% | -5.25% |
| Arizona | 9.74% | 3.83% | 5.88% | 1.54% | 4.34% |
| Arkansas | 3.02% | 2.01% | 0.99% | 0.74% | 0.25% |
| California | 6.11% | 4.77% | 1.38% | 2.87% | -1.49% |
| Colorado | 11.45% | 4.52% | 6.84% | 1.36% | 5.48% |
| Connecticut | 0.39% | 1.32% | -0.93% | 3.35% | -4.28% |
| Delaware | 7.11% | 2.27% | 4.85% | 1.98% | 2.87% |
| District of Columbia | 15.24% | 5.46% | 9.57% | 4.48% | 5.09% |
| Florida | 11.57% | 1.25% | 10.27% | 4.83% | 5.44% |
| Georgia | 7.63% | 4.11% | 3.48% | 1.80% | 1.68% |
| Hawaii | 4.93% | 4.10% | 0.89% | 4.00% | -3.11% |
| Idaho | 9.50% | 4.83% | 4.64% | 0.73% | 3.90% |
| Illinois | -0.23% | 3.07% | -3.30% | 1.71% | -5.01% |
| Indiana | 2.81% | 2.61% | 0.23% | 1.12% | -0.89% |
| Iowa | 3.24% | 2.45% | 0.80% | 1.38% | -0.58% |
| Kansas | 2.10% | 3.52% | -1.42% | 1.49% | -2.91% |
| Kentucky | 2.64% | 1.89% | 0.77% | 1.06% | -0.29% |
| Louisiana | 3.32% | 3.22% | 0.08% | 1.13% | -1.05% |
| Maine | 0.57% | -0.41% | 1.04% | 0.74% | 0.30% |
| Maryland | 4.81% | 3.37% | 1.48% | 3.42% | -1.94% |
| Massachusetts | 4.75% | 1.87% | 2.94% | 4.45% | -1.51% |
| Michigan | 0.79% | 1.55% | -0.75% | 1.53% | -2.28% |
| Minnesota | 5.13% | 3.84% | 1.34% | 1.95% | -0.61% |
| Mississippi | 0.54% | 2.04% | -1.52% | 0.49% | -2.01% |
| Missouri | 2.08% | 2.14% | -0.04% | 0.92% | -0.96% |
| Montana | 6.17% | 2.13% | 4.02% | 0.25% | 3.77% |
| Nebraska | 5.12% | 4.18% | 0.97% | 1.64% | -0.67% |
| Nevada | 11.00% | 3.72% | 7.26% | 1.89% | 5.37% |
| New Hampshire | 2.00% | 0.75% | 1.30% | 1.08% | 0.22% |
| New Jersey | 2.43% | 2.63% | -0.21% | 4.28% | -4.49% |
| New Mexico | 1.40% | 3.25% | -1.85% | 0.86% | -2.71% |
| New York | 2.43% | 3.22% | -0.79% | 4.48% | -5.27% |
| North Carolina | 7.71% | 2.70% | 4.95% | 1.53% | 3.42% |
| North Dakota | 12.28% | 4.77% | 7.28% | 1.48% | 5.81% |
| Ohio | 1.06% | 1.56% | -0.47% | 1.20% | -1.67% |
| Oklahoma | 4.77% | 2.78% | 1.98% | 1.24% | 0.75% |
| Oregon | 8.12% | 2.19% | 5.93% | 1.21% | 4.72% |
| Pennsylvania | 0.81% | 0.71% | 0.16% | 1.85% | -1.69% |
| Rhode Island | 0.64% | 0.83% | -0.17% | 3.02% | -3.19% |
| South Carolina | 8.61% | 1.97% | 6.57% | 0.86% | 5.71% |
| South Dakota | 6.80% | 4.22% | 2.56% | 1.10% | 1.46% |
| Tennessee | 5.82% | 1.96% | 3.85% | 1.04% | 2.80% |
| Texas | 12.51% | 6.06% | 6.41% | 2.67% | 3.74% |
| Utah | 12.18% | 9.18% | 3.02% | 1.21% | 1.81% |
| Vermont | -0.33% | 0.49% | -0.77% | 0.86% | -1.63% |
| Virginia | 5.84% | 3.54% | 2.29% | 2.96% | -0.67% |
| Washington | 10.10% | 3.85% | 6.26% | 2.56% | 3.69% |
| West Virginia | -2.00% | -0.73% | -1.25% | 0.29% | -1.53% |
| Wisconsin | 1.90% | 2.25% | -0.31% | 0.90% | -1.21% |
| Wyoming | 2.75% | 3.80% | -1.11% | 0.45% | -1.57% |
| Puerto Rico | -10.45% | 1.15% | -11.61% | -11.61% | (X) |
Source: U.S. Census Bureau
by Jeffrey L Garceau