The Opioid Crisis Moved as it Grew. Analysis Suggests Poverty Not Indicative of State Opioid Death Rates, but Unemployment Rates Show a Trend
The opioid epidemic is possibly the most severe public health crisis in the United States, and it has afflicted the country at alarmingly increasing rates. 2015 saw the national age-adjusted death rate increase to 10.4  deaths per 100,000 population, a five-year increase of 42 percent, and a 10-year increase of 76 percent. The chart at right (click to expand) shows the 10-year national trend, showing a steady upward trajectory, which has accelerated since 2012.
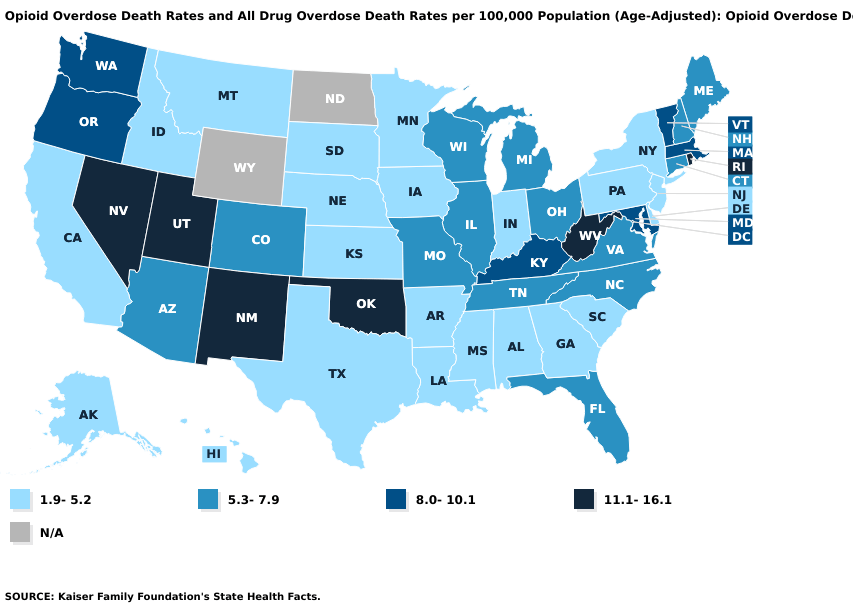
Opioid overdose death rates are particularly concerning for certain states, as the ten-year increase is not distributed equally across the nation. Look at the maps below, the first showing state opioid overdose death rates in 2006, and the second in 2015. The most heavily afflicted states are largely in the southwest, with the exception of West Virginia, which suffered the worst death rate of all states if 16.1 per 100,000. By 2015, while problems in the southwest remain, the highest opioid overdose death rates occur in states of which a large part is part of Appalachia, namely West Virginia, Kentucky, and Ohio. The New England states are also severely impacted. Not only has the geographic center of the crisis shifted, but West Virginia’s 2006 death rate of 16.1 would only be the 11th highest state death rate in 2015. West Virginia still had the highest rate of all states, but increased by 2015 to 36.0 deaths per 100,000, an increase of 124 percent.

What is the Cause?
There are too many elements that have led to the opioid crisis to try to ‘explain’ the crisis in one or two factors. Medical standards, regulatory reform, and a host of demographic and economic variables all play a part, before even trying to account for cultural and other hard-to-measure considerations.
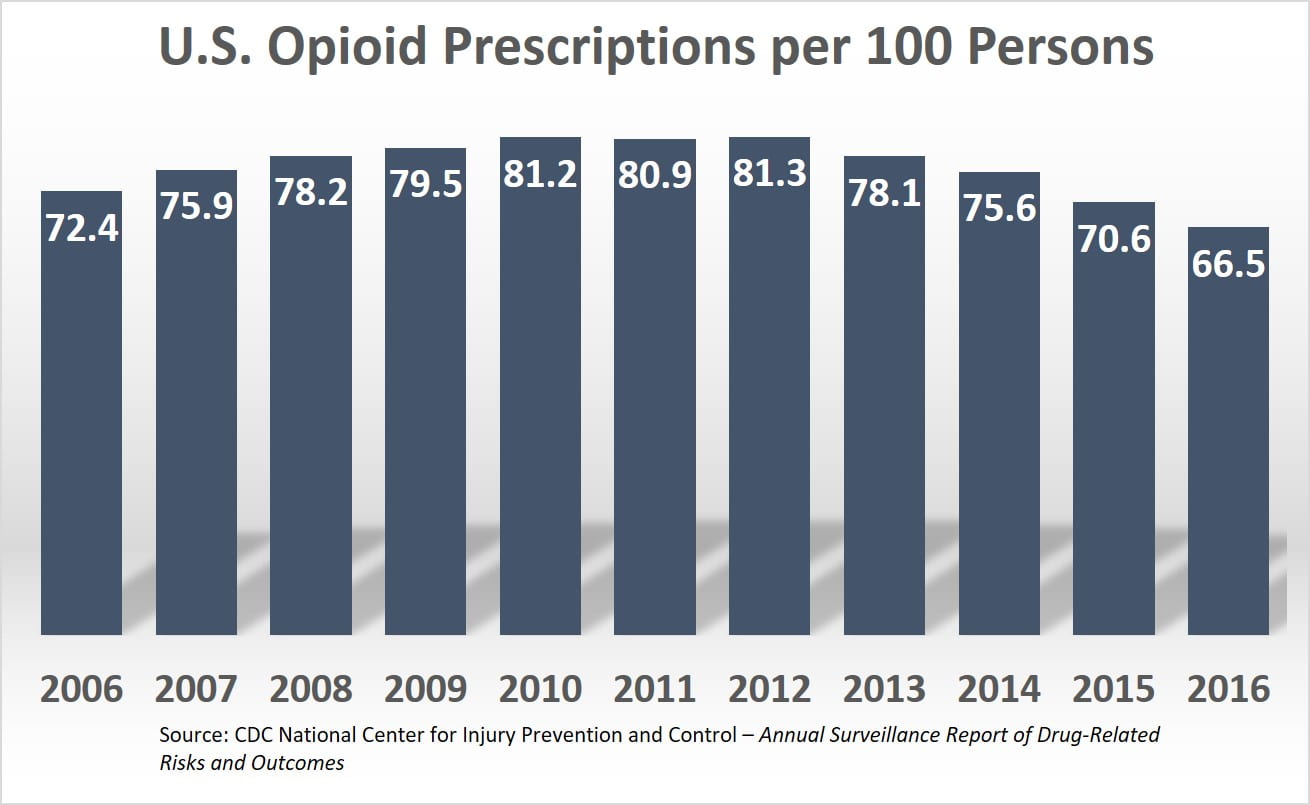
Opioid prescriptions are widespread, though they are on the decline. A report from the Centers for Disease Control and Prevention shows that the rate of prescriptions increased from 2006 to 2010, and began a decline following 2012. 2012 was the peak year for prescriptions. That year, 81.3 prescriptions were written for every 100 persons in the U.S., meaning enough prescriptions were written that year alone to be distributed to four out of every five Americans. Even after four years of steady decline, as of 2016, there was still an opioid prescription written for two out of every three people in the U.S.
How much influence do economic factors play a role? We ran a multiple regression analysis of opioid death rates in 2015 for all 50 states, based on whether a relationship existed between opioid death rates and unemployment rates. We examined this relationship, holding constant for state GDP per capita, uninsured rates, and other non-opioid drug death rates*. The result was a R-squared score of .33, meaning the model explained about one-third of the variation in the independent variable, which is opioid death rates. Put another way, statistically speaking, these economic factors account for about one-third of explaining opioid death rates in U.S. states.
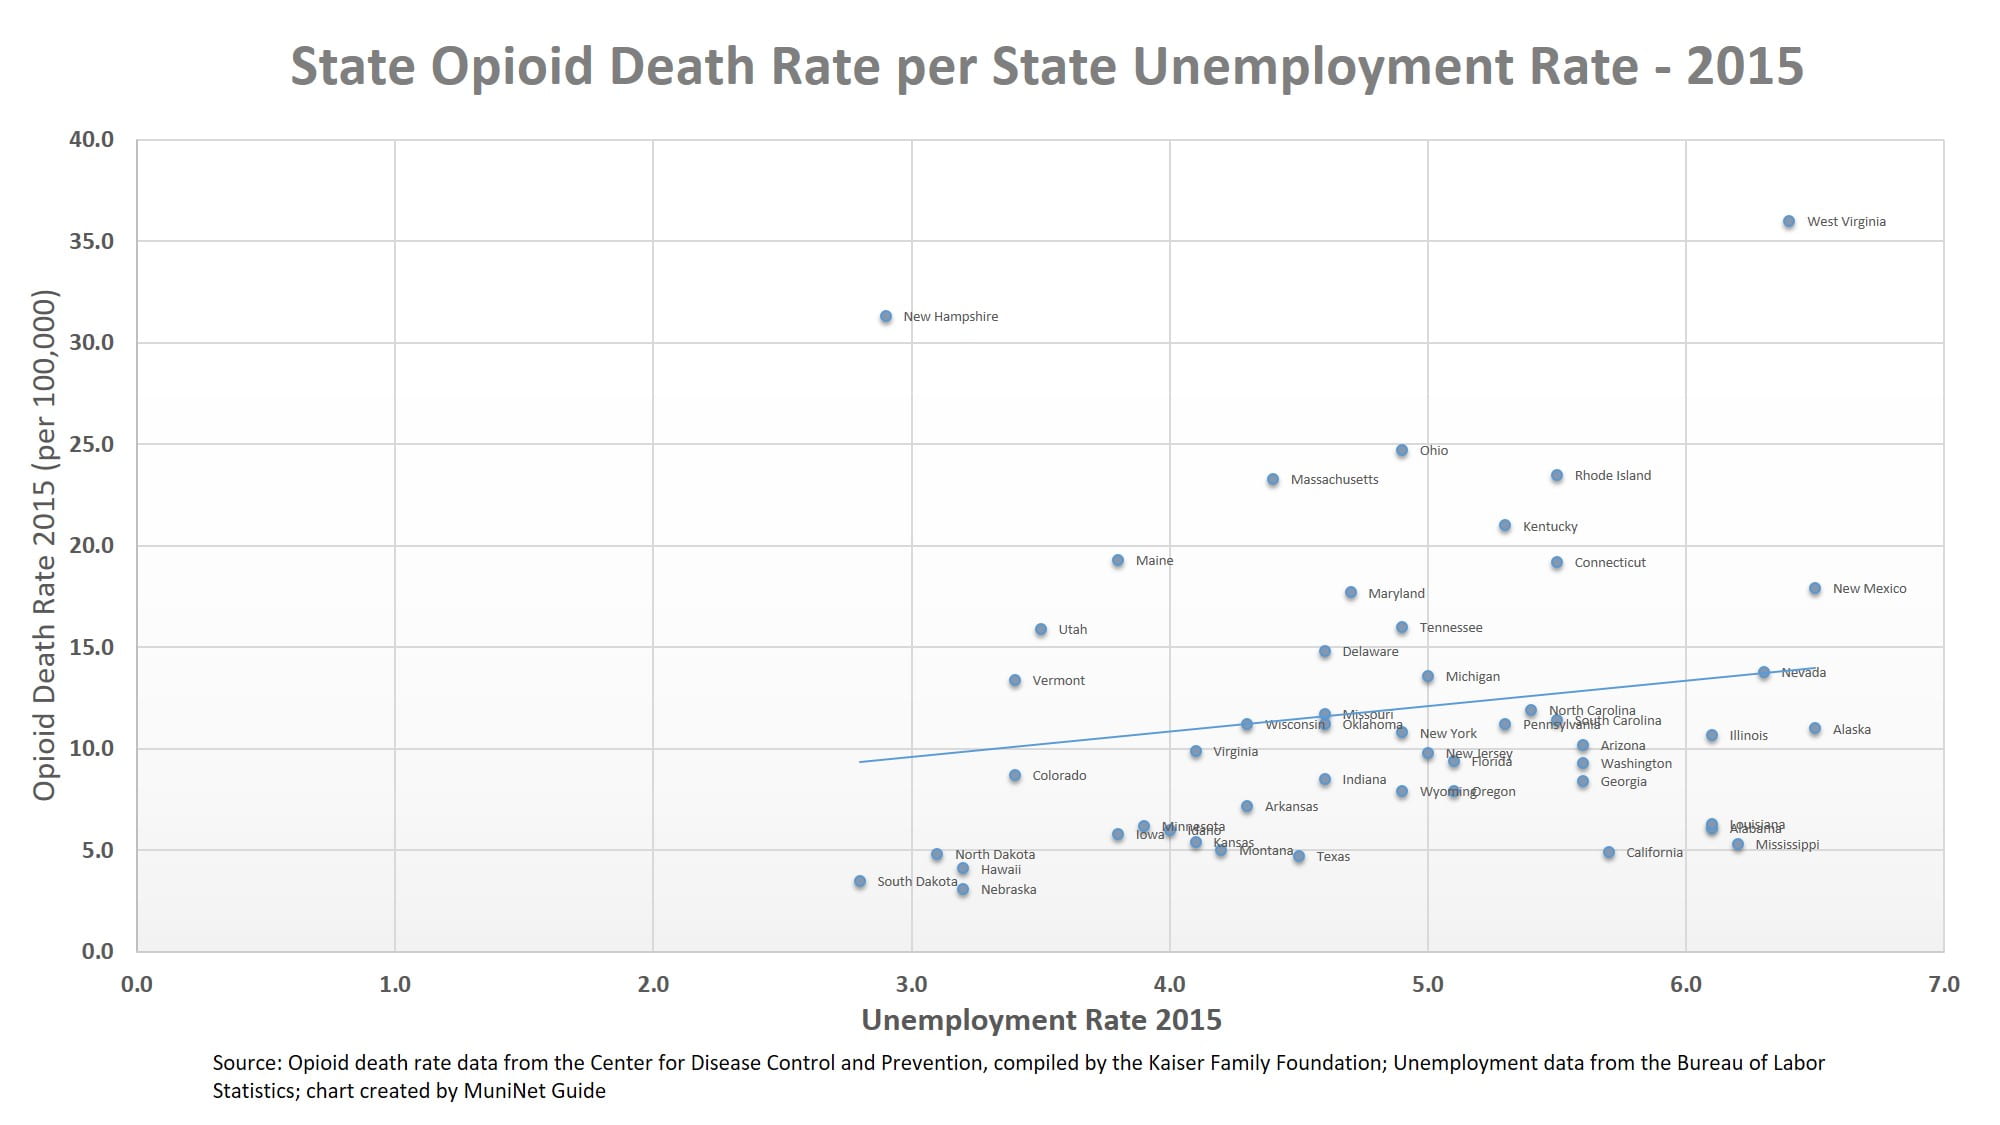
A plot of the data shows that a states opioid death rate is positively correlated with its unemployment rate. However, we can also visually see that, as the statistical analysis confirmed, the correlation is not very strong. Most notably, West Virginia and New Hampshire have opioid death rates that are much higher than any other states, and are at opposite ends of the spectrum of unemployment rates for all states. Unemployment seems likely to be a factor, but just getting people wanted employment isn’t going to go far in solving the crisis. You can click on the chart for an expanded view to find individual states.
A Local Problem
Opioid addictions and death is a national crisis, but in many ways solving it is a local problem. Investments in treatments and other factors that may mitigate the crisis will be made and administered locally, although state and federal resources can be leveraged to help, especially for cities and regions where local resources may be stretched or lacking. Ohio and its localities are an example of state and local governments that have taken a proactive and aggressive approach to addressing the crisis and demanding accountability. Summit County Executive Ilene Shapiro signed a proclamation in the fall declaring the opioid crisis to have caused a state of emergency. She has asked for state and federal funding should it become available. More than a dozen Summit County communities, including Akron, have filed suit against pharmaceutical companies, claiming unfair and deceptive marketing of opioids that downplayed the risks. The state of Ohio has filed a separate but similar suit.
Further analysis of factors that could influence localities and regions to become more highly susceptible to opioid addiction is warranted, as is more aggressive action at all levels of government. Although pharmaceutical treatments are and can be necessary and effective, the recent downward trend of prescriptions may hopefully lead to decreased addiction and overdose deaths. Governmental agencies like the U.S. Department of Health and Human Services, and private organizations like the American Association of Retired Persons (AARP) provide educational resources on alternative treatments and lifestyle changes to address chronic pain. If you or someone you know is suffering with substance abuse, the Substance Abuse and Mental Health Services Administration’s national hotline is 1-800-662-HELP (4357).
All data are for the year 2015:
Opioid death rate and other drug data comes from the CDC, compiled by the Kaiser Family Foundation – Opioid Overdose Death Rates and All Drug Overdose Death Rates per 100,000 Population (Age-Adjusted)
Per capita real GDP data comes from the U.S. Bureau of Economic Analysis
Unemployment rate data comes from the U.S. Bureau of Labor Statistics
Uninsured rate and poverty rate data comes from the U.S. Census Bureau’s American Community Survey 5-year Estimates
*All independent variables had p-values that indicated statistical significance to the 90th percentile, and GDP per capita, unemployment rate, and uninsured rate all were statistically significant to the 99th percentile. The significance of the independent variables is of questionable relevance. We are using data from the entire population of ‘U.S. States’, so the p-values from one perspective may be meaningless. However, considering the data is only for 2015, and the data has and will change over time for a variety of other factors, the significance of the independent variables may be of interest for readers when drawing predictive conclusions for future years.
by Jeffrey L Garceau