State GDP Growth in the Third Quarter Showed Positive Momentum in All 50 States
Today, the U.S. Bureau of Economic Analysis released the figures for Gross Domestic Product growth in U.S. states plus the District of Columbia. All 50 states and D.C. saw positive growth, ranging from 5.7 percent in Delaware to 0.5 percent in South Dakota.
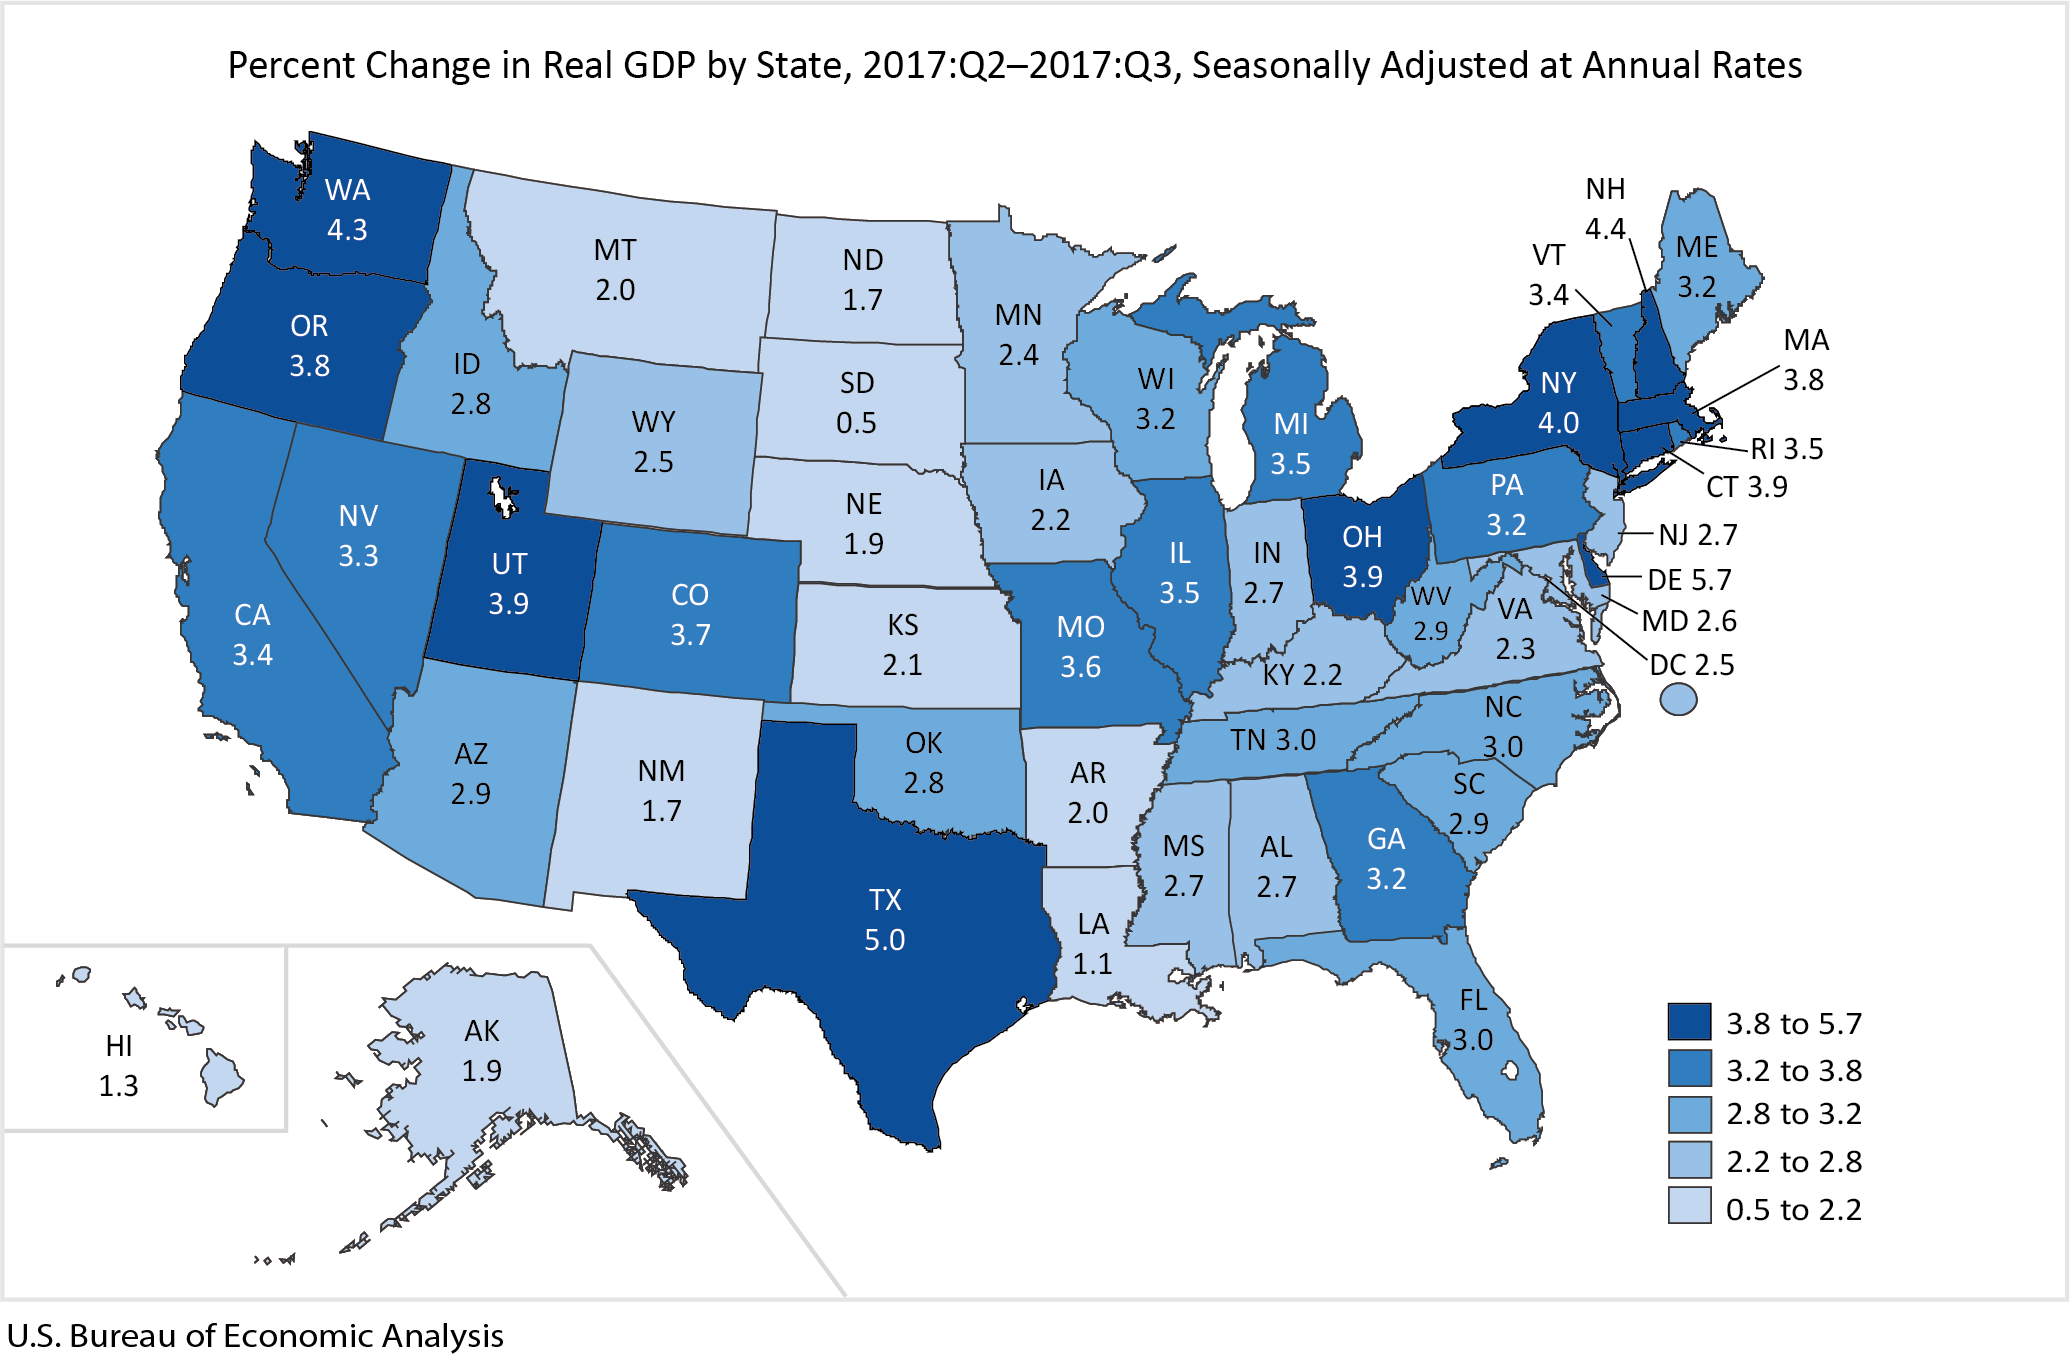 The map at left clearly demonstrates (click to expand) a concentration of high growth in the northeast and northwest. While growth is universal across the states, several plains states stretching from Montana to Kansas were outpaced by the rest of the nation. After Delaware, New Hampshire, Texas, Washington, and New York rounded out the top-five fastest growing state economies.
The BEA breaks state economic activity into 21 different industries, and 17 of those sectors experienced positive growth in the third quarter. Finance and insurance was the fastest growing sector, while non-durable goods manufacturing experienced the most decline. BEA defines non-durable goods as “Tangible products that can be stored or inventoried and that have an average life of less than three years.”
Regional Trends
The chart below (click to expand) shows the trend-line GDP growth for each of the BEA’s economic regions over the past six quarters, from Q2 2016 to Q3 2017. It reveals that the Southwest experienced the highest growth rate, and the Plains region the lowest. However, the Plains have also experienced a notable turnaround from the first quarter of 2017. The steady economic growth of the Southeast (orange line) is also notable. All regions are seeing a tightening in their growth rates, as we see the GDP growth rates for the third quarter of 2017 bunched tightly together, compared with the wide variance in growth rates at the beginning of the year.
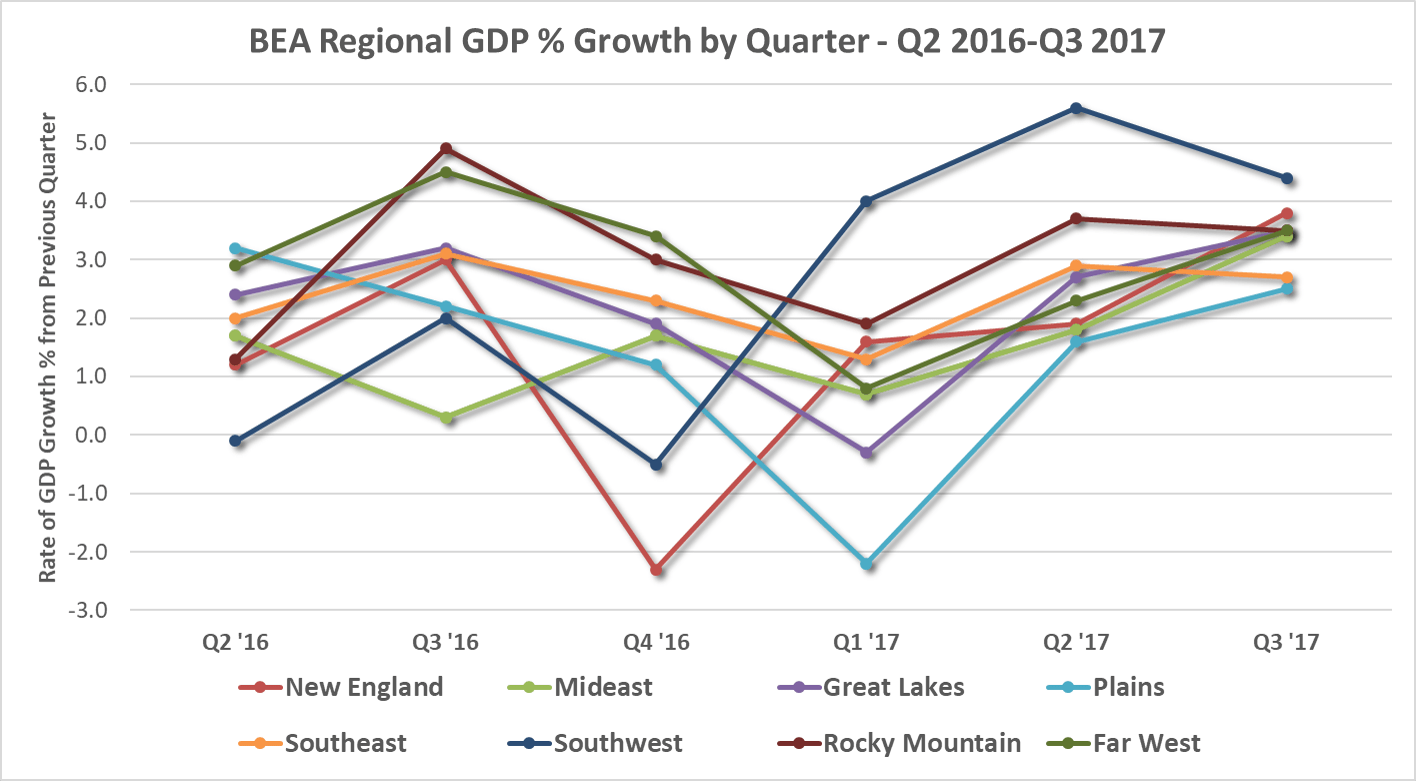
The BEA designed its regions as groupings of states based on the homogeneity of the states in terms of economic characteristics, such as the industrial composition of the labor force, and in terms of demographic, social, and cultural characteristics. While these regions were developed in the mid-1950s, and the makeup of the states has changed, the regions have been formed to reflect a particular economic character for each region.
National numbers reported in this article are slightly different from the numbers commonly reported for the entire U.S. in other reports, as they are a composite of activity within the states. Thus, they do not include overseas economic activity of the Federal government, which gets reported in the traditional national figures. However, the general growth trend is consistent.
Taking a deeper look at the data shows much going on underneath the surface of the overall national figures. Our state and local economies influence how we perceive the country is doing, in as much as Gross Domestic Product is a proper measurement of economic performance. Access to the full set of data provided by the BEA can be found here.
by Jeffrey L Garceau