Report – U.S. State Crime Rates by Type for All 50 States, D.C., and Puerto Rico
This report gives researchers and citizens an opportunity to look at U.S. state crime rates, what crimes are being committed and in what frequency, for all 50 states plus Puerto Rico and the District of Columbia. Included is a brief write up on each state, Puerto Rico, D.C., as well as a look at the medians for U.S. states. All figures are as of the FBI’s 2016 Uniform Crime Reports, the most recent data available.
Readers can compare overall crime rates or rates for specific types of crimes between states, or states to the U.S. state median levels, and read individual state profiles to gain a deeper understanding of crime in that state. The figures listed are rates per 100,000 inhabitants; statistically, they are comparable. The FBI cautions against drawing overly strong conclusions from ranking crime statistics, and MuniNet and the author make no judgments of specific jurisdictions discussed. After the individual state profiles, we detail how the FBI recommends proper use of their statistics. Also following the profiles is detail on how the FBI defines each crime category. Some of the language in crime definitions may be unsettling for some readers. Click on any chart to expand it for a closer view.
U.S. Medians
The total median U.S. State crime rates in 2016 for violent crimes is 370.3 per 100,000 inhabitants, and property crime rates are 2,582.1. Larceny-theft is by far the most common crime committed, consisting of 63 percent of all crimes, followed by burglary at 16 percent. Aggravated assault accounts for 9 percent, motor vehicle theft at 8 percent, robbery 3 percent, rape (revised definition) 1 percent, and murder/non-negligent manslaughter making up a statistical fraction of a single percent of overall crimes. While the levels of individual states certainly vary considerably, these proportions hold fairly steady across jurisdictions. Violent crime rate figures include the offenses of murder, rape (revised definition), robbery, and aggravated assault.
Alabama
The State of Alabama reported 532.3 violent crimes and 2,947.8 property crimes per 100,000 inhabitants for 2016. Both are higher than the national median, with the violent crime rate being 43.7 percent higher, and the property crime rate being 14.2 percent higher. While the proportions line up with national medians, larceny-theft made up 5 percent less of the total crime rate than the state median, and burglary made up 4 percent more.
Alaska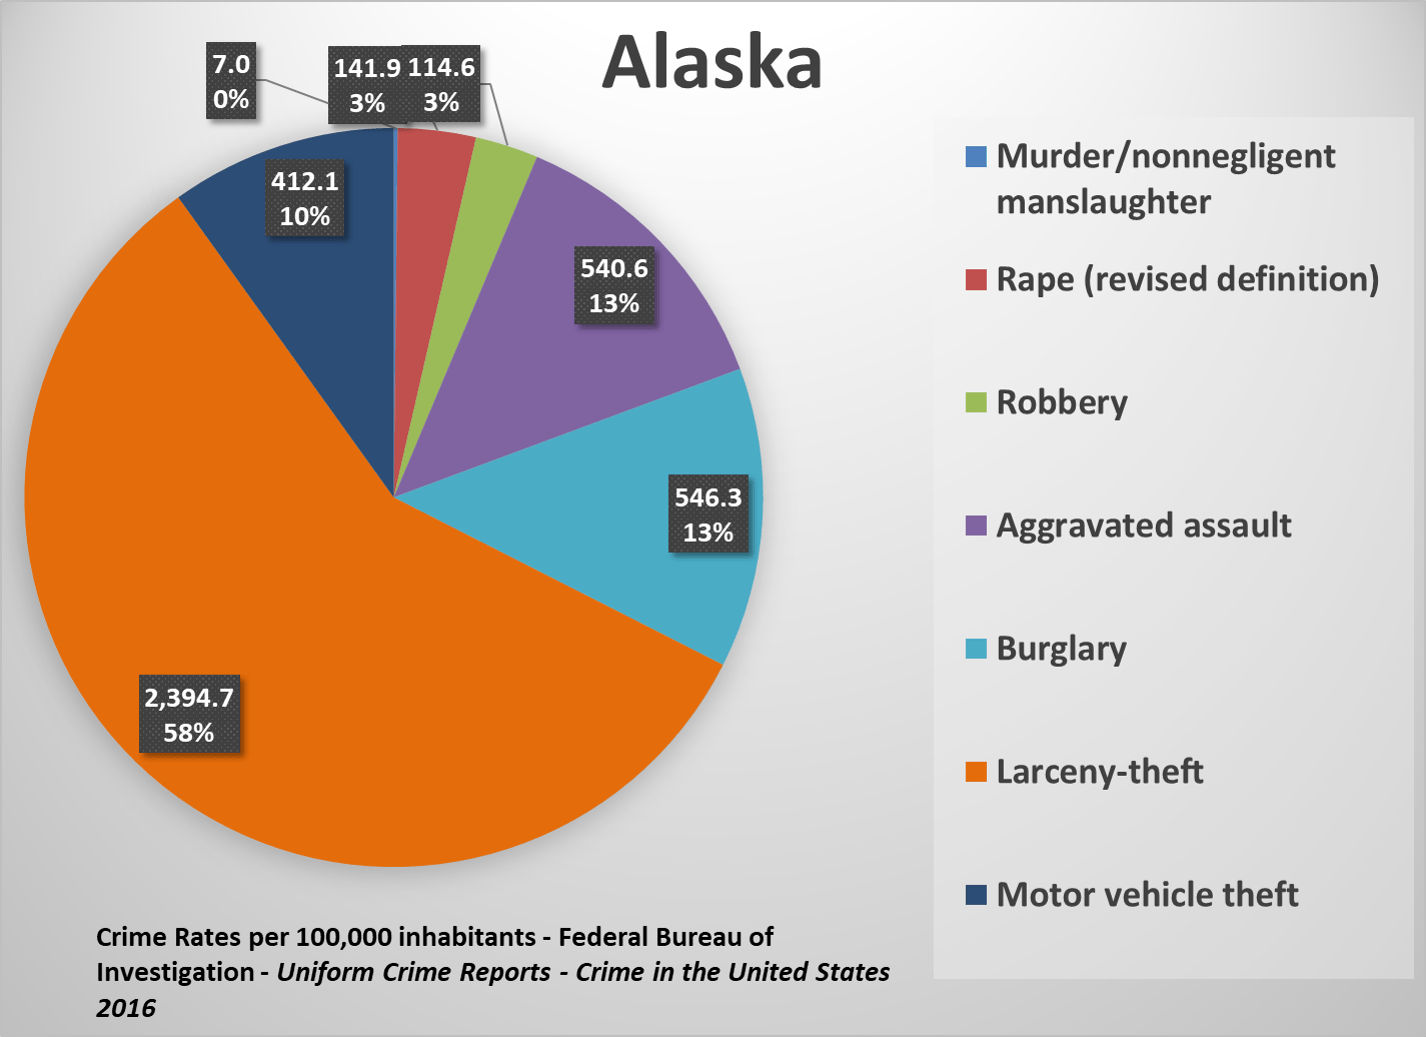
The State of Alaska reported 804.2 violent crimes and 3,353.0 property crimes per 100,000 inhabitants for 2016. Both are higher than the national median, with the violent crime rate being 117.2 percent higher, and the property crime rate being 29.9 percent higher. Alaska is a state for which there is actually a discrepancy in proportional makeup of crime types from national medians. Rape made up 3 percent of all crime in Alaska in 2016, and its rate of 141.9 is more than double the national median.
Arizona
The State of Arizona reported 470.1 violent crimes and 2,978.4 property crimes per 100,000 inhabitants for 2016. Both are higher than the national median, with the violent crime rate being 27.0 percent higher, and the property crime rate being 15.3 percent higher. Arizona’s percentage makeup of types of crime lines up exactly with national medians.
Arkansas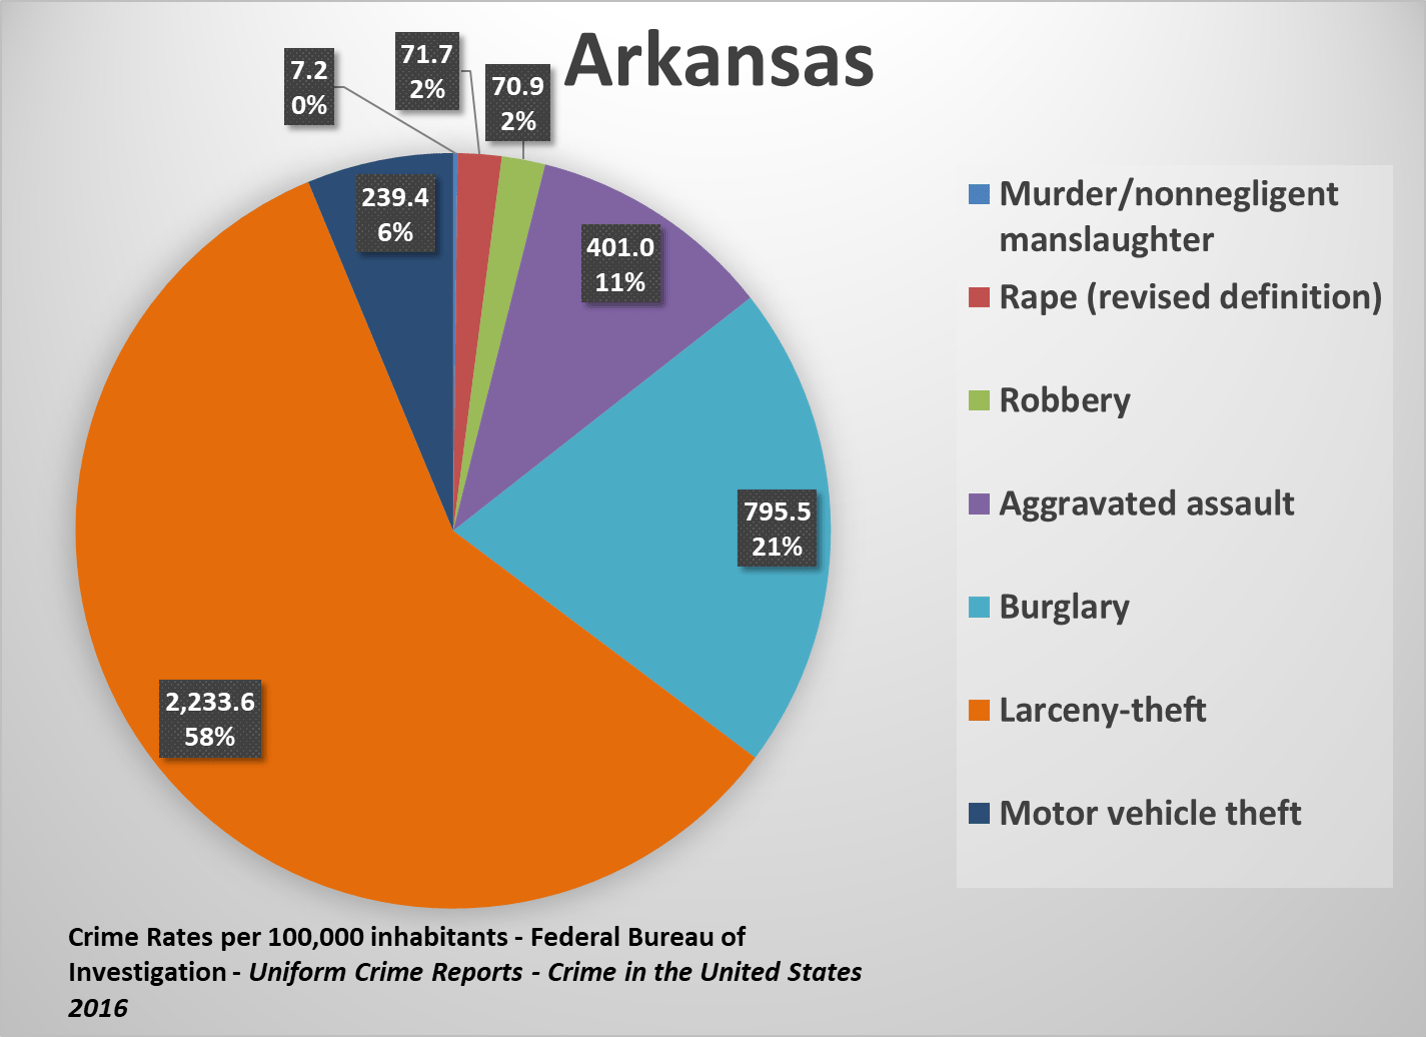
The State of Arkansas reported 550.9 violent crimes and 3,268.6 property crimes per 100,000 inhabitants for 2016. Both are higher than the national median. The violent crime rate being 48.8 percent higher, and the property crime rate being 26.6 percent higher. Arkansas’ percentage makeup of crimes by type shows burglary makes up a higher proportion of crimes in Arkansas (21 percent) than the national median (16 percent)
California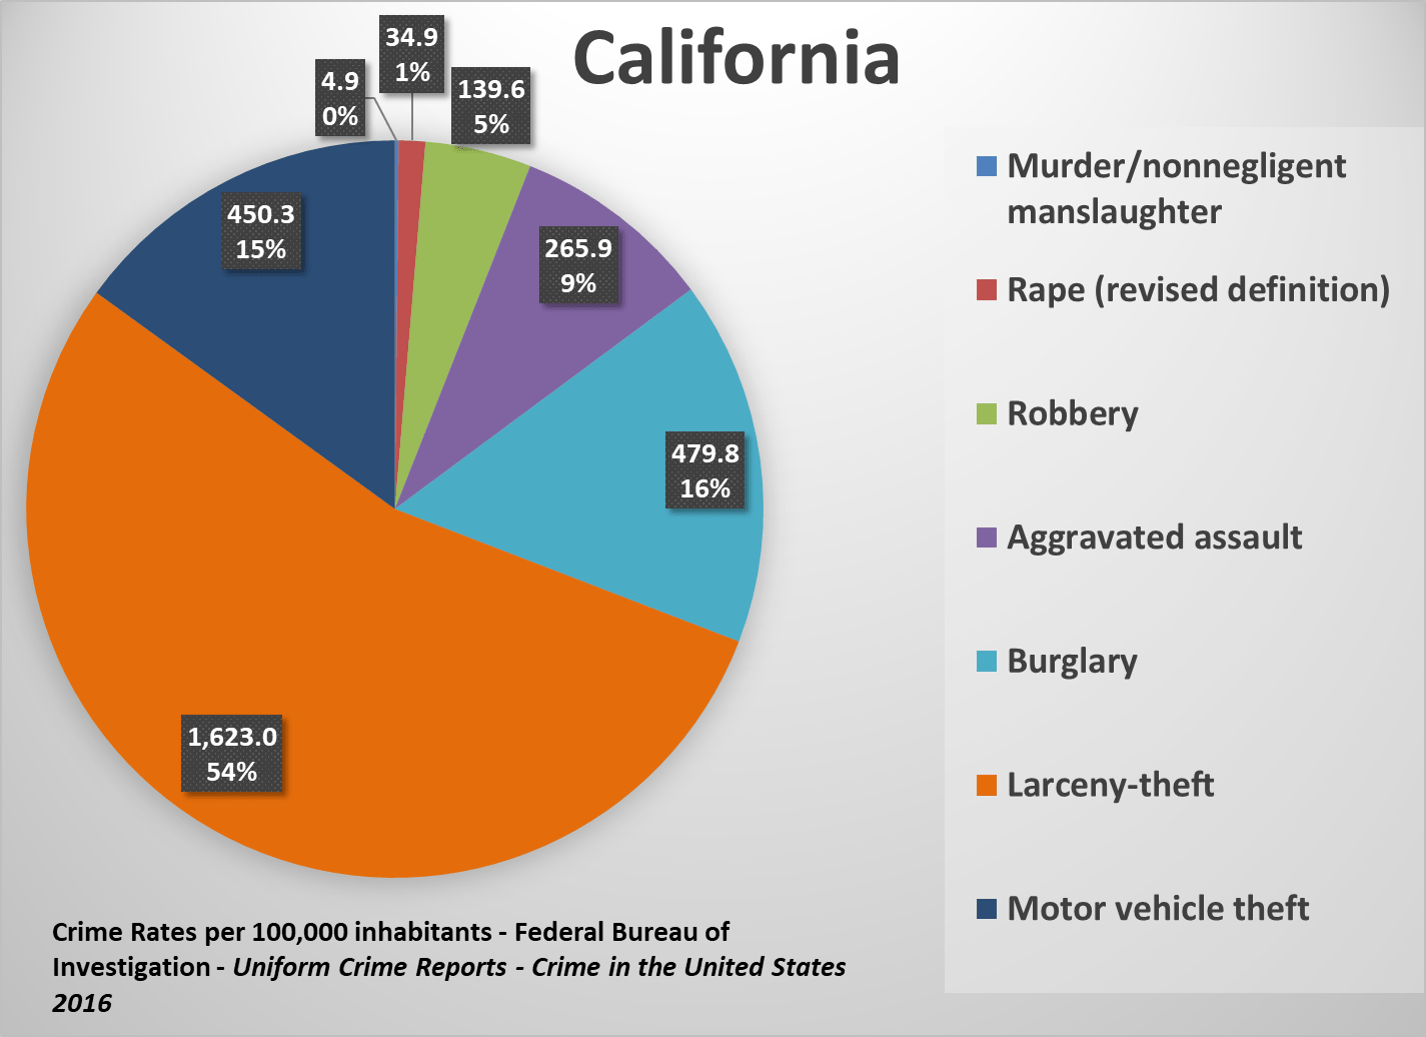
The State of California reported 445.3 violent crimes and 2,553.0 property crimes per 100,000 inhabitants for 2016. Violent crime rates in California are higher than the national median, while property crime is slightly lower. The violent crime rate is 20.3 percent higher than the national median, and the property crime rate is 1.1 percent lower. In California, larceny-theft makes up a significantly lower proportion of overall crimes (54 percent) than the national median (63 percent). Motor vehicle theft makes up 15 percent of all crimes, much higher than the 8 percent national median. The rate for motor vehicle theft in California is more than double the national median.
Colorado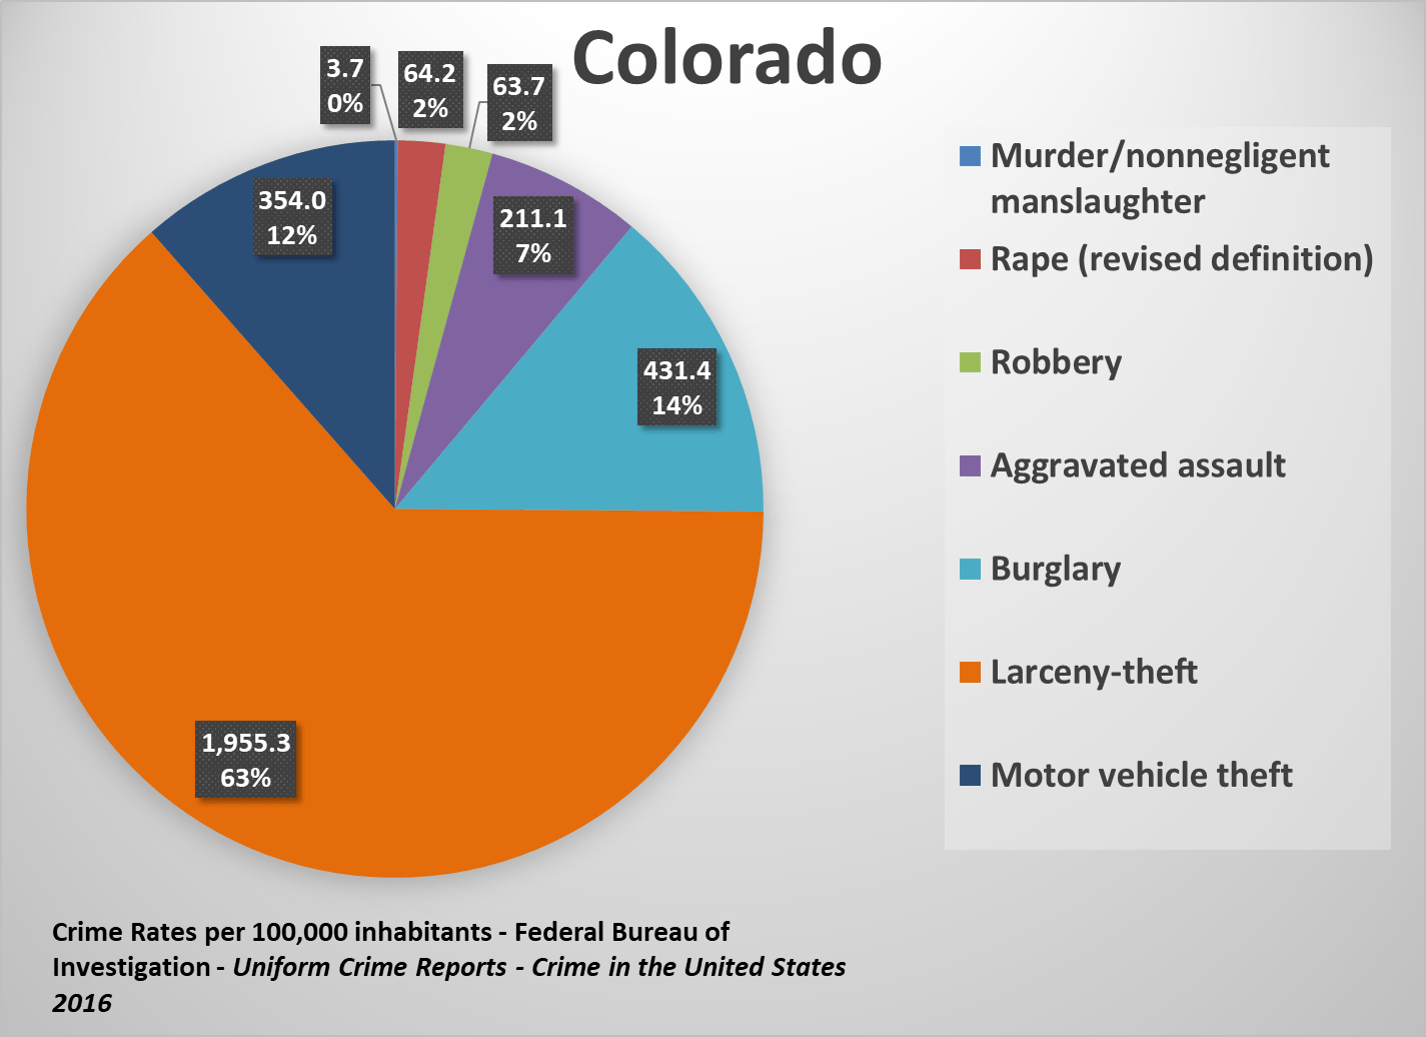
The State of Colorado reported 342.6 violent crimes and 2,740.7 property crimes per 100,000 inhabitants for 2016. The violent crime rate is lower (-7.5 percent) than the national median. The property crime rate is higher (6.1 percent) than the national median. Colorado has a very similar proportional crime profile to the national median. However, motor vehicle theft is slightly more common related to other crimes (12 percent) than the national median (8 percent).
Connecticut
The State of Connecticut reported 227.1 violent crimes and 1,808.0 property crimes per 100,000 inhabitants for 2016. Both the violent crime and property crime rates are notably lower than the national median. The violent crime rate is 38.7 percent lower, and the property crime rate 30.0 percent lower. Connecticut has a similar proportional makeup of crimes by type to the national median. Connecticut has a very low murder/non-negligent manslaughter of only 2.2 per 100,000 inhabitants.
Delaware
The State of Delaware reported 508.8 violent crimes and 2,766.0 property crimes per 100,000 inhabitants for 2016. Both the violent crime and property crime rates are higher than the national median. The violent crime rate is 37.4 percent higher, and the property crime rate 7.1 percent higher. Delaware has a similar proportional makeup of crimes by type to the national median.
District of Columbia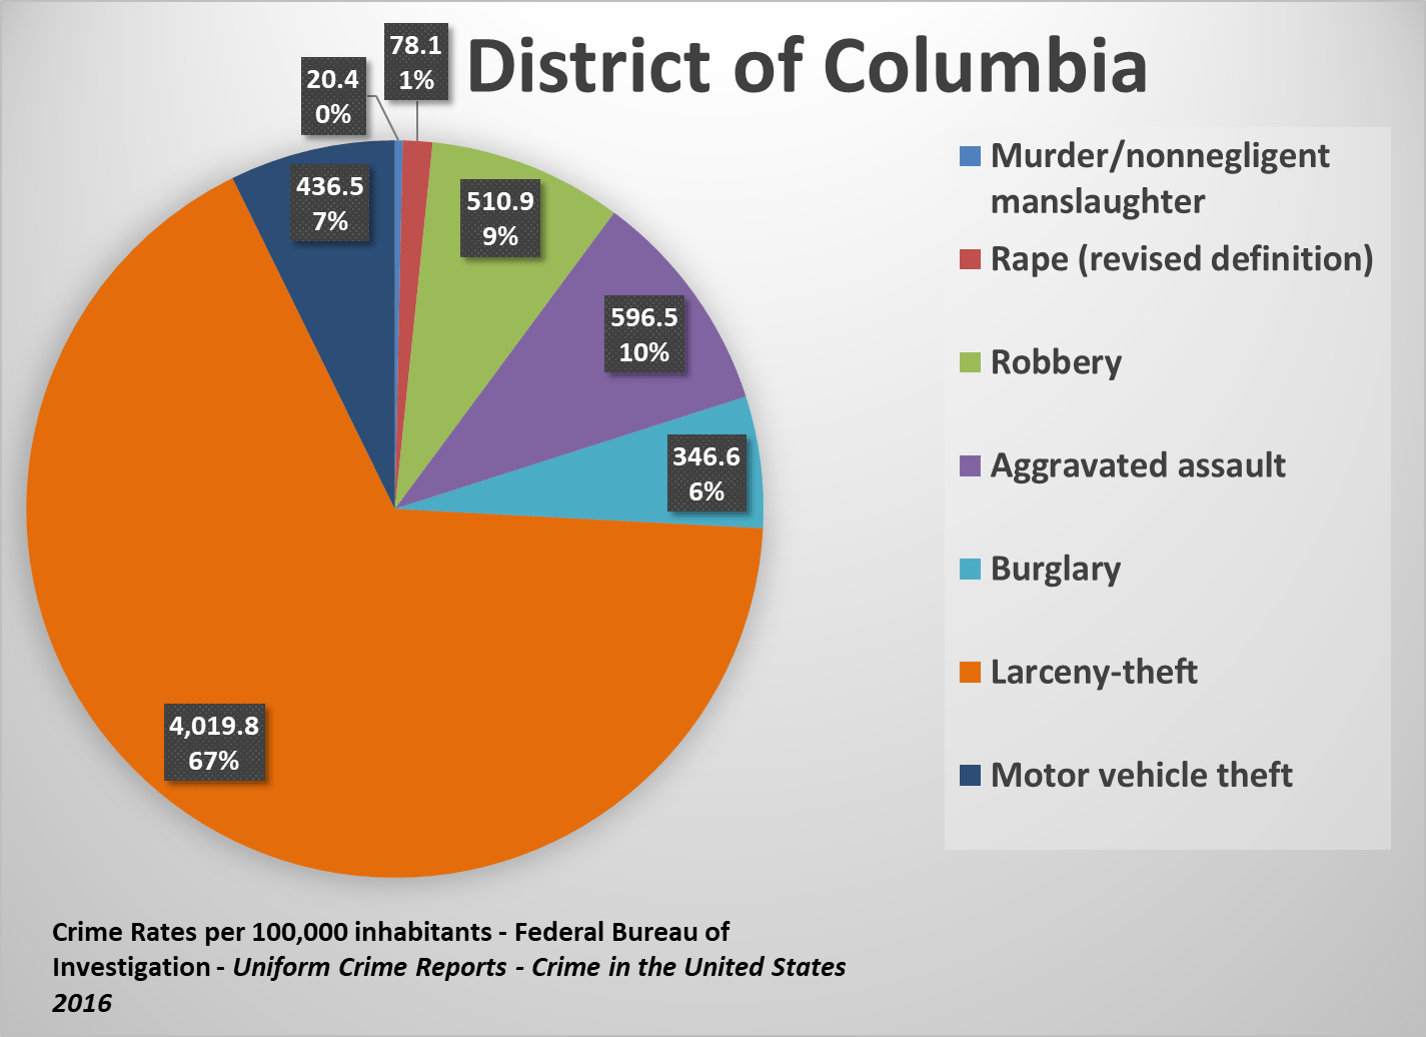
The District of Columbia reported 1205.9 violent crimes and 4802.9 property crimes per 100,000 inhabitants for 2016. Both the violent crime and property crime rates are much higher than the national median. However, this is a situation where caution must be given to comparisons, due to the urbanization of D.C., among other factors. D.C. has a similar proportional makeup of crimes by type to the national median, with the exception that burglary is a smaller proportion (6 percent in D.C. compared to 16 percent nationally) while robbery is a far larger proportion (9 percent in D.C. compared to 3 percent nationally).
Florida
The State of Florida reported 430.3 violent crimes and 2,686.8 property crimes per 100,000 inhabitants for 2016. Florida’s violent crime rate is 16.2 percent higher than the national median, and the property crime rate is 4.1 percent higher. Florida has a similar proportional makeup of crimes by type to the national median.
Georgia
The State of Georgia reported 397.6 violent crimes and 3,004.5 property crimes per 100,000 inhabitants for 2016. Georgia’s violent crime rate is 7.4 percent higher than the national median, and the property crime rate is 16.4 percent higher. Georgia has a similar proportional makeup of crimes by type to the national median.
Hawaii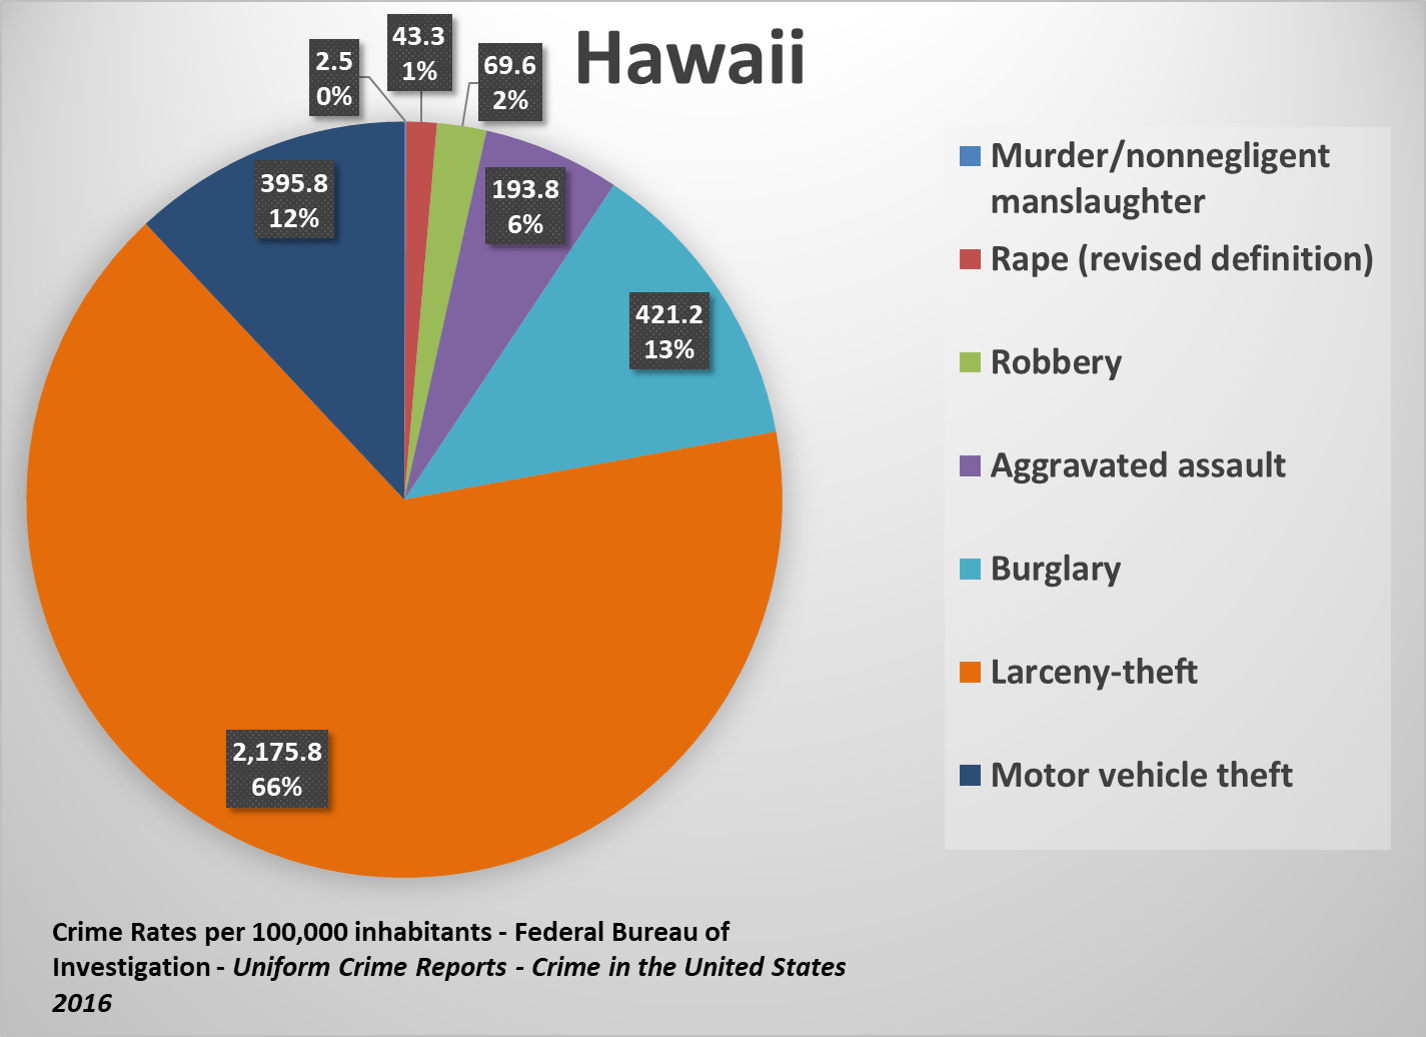
The State of Hawaii reported 309.2 violent crimes and 2,992.7 property crimes per 100,000 inhabitants for 2016. Hawaii’s violent crime rate is 16.5 percent lower than the national median, and the property crime rate is 15.9 percent higher. Hawaii has a similar proportional makeup of crimes by type to the national median, with the exception being that motor vehicle theft makes up 12 percent of overall crime, compared to 8 percent nationally.
Idaho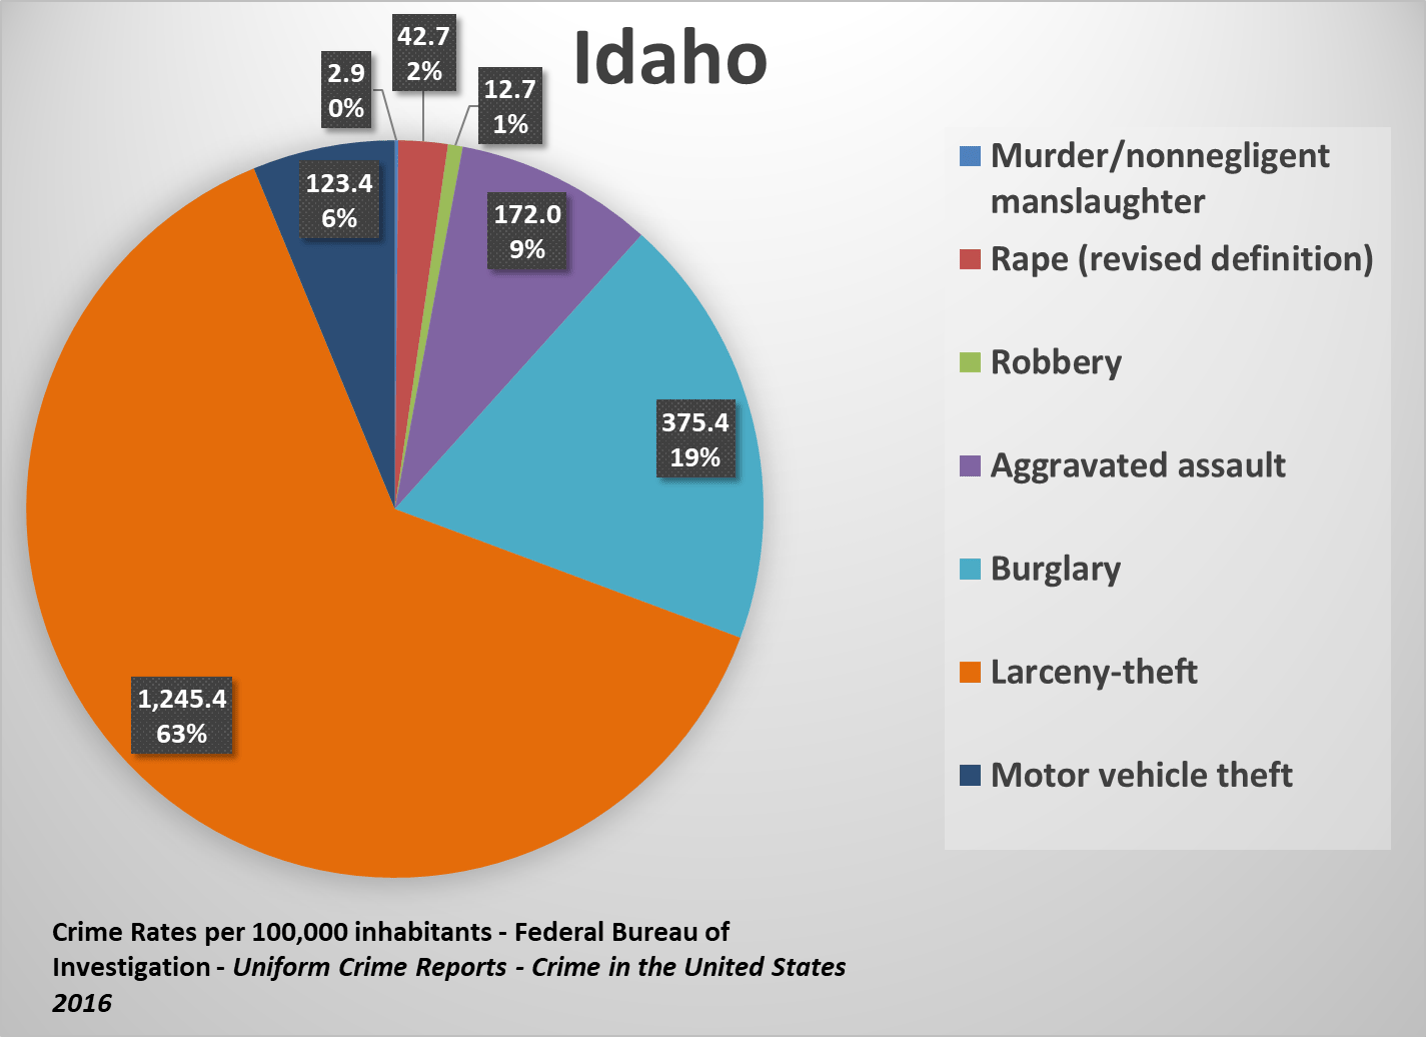
The State of Idaho reported 230.3 violent crimes and 1,744.2 property crimes per 100,000 inhabitants for 2016. Idaho’s violent crime rate is 37.8 percent lower than the national median, and the property crime rate is 32.5 percent lower. Idaho has a similar proportional makeup of crimes by type to the national median.
Illinois
The State of Illinois reported 436.3 violent crimes and 2,049.0 property crimes per 100,000 inhabitants for 2016. Illinois’ violent crime rate is 17.8 percent higher than the national median, and the property crime rate is 20.6 percent lower. Illinois has a similar proportional makeup of crimes by type to the national median.
Indiana
The State of Indiana reported 404.7 violent crimes and 2,589.4 property crimes per 100,000 inhabitants for 2016. Indiana’s violent crime rate is 9.3 percent higher than the national median, and the property crime rate is virtually at the median, being only 0.3 percent higher. Indiana has a similar proportional makeup of crimes by type to the national median.
Iowa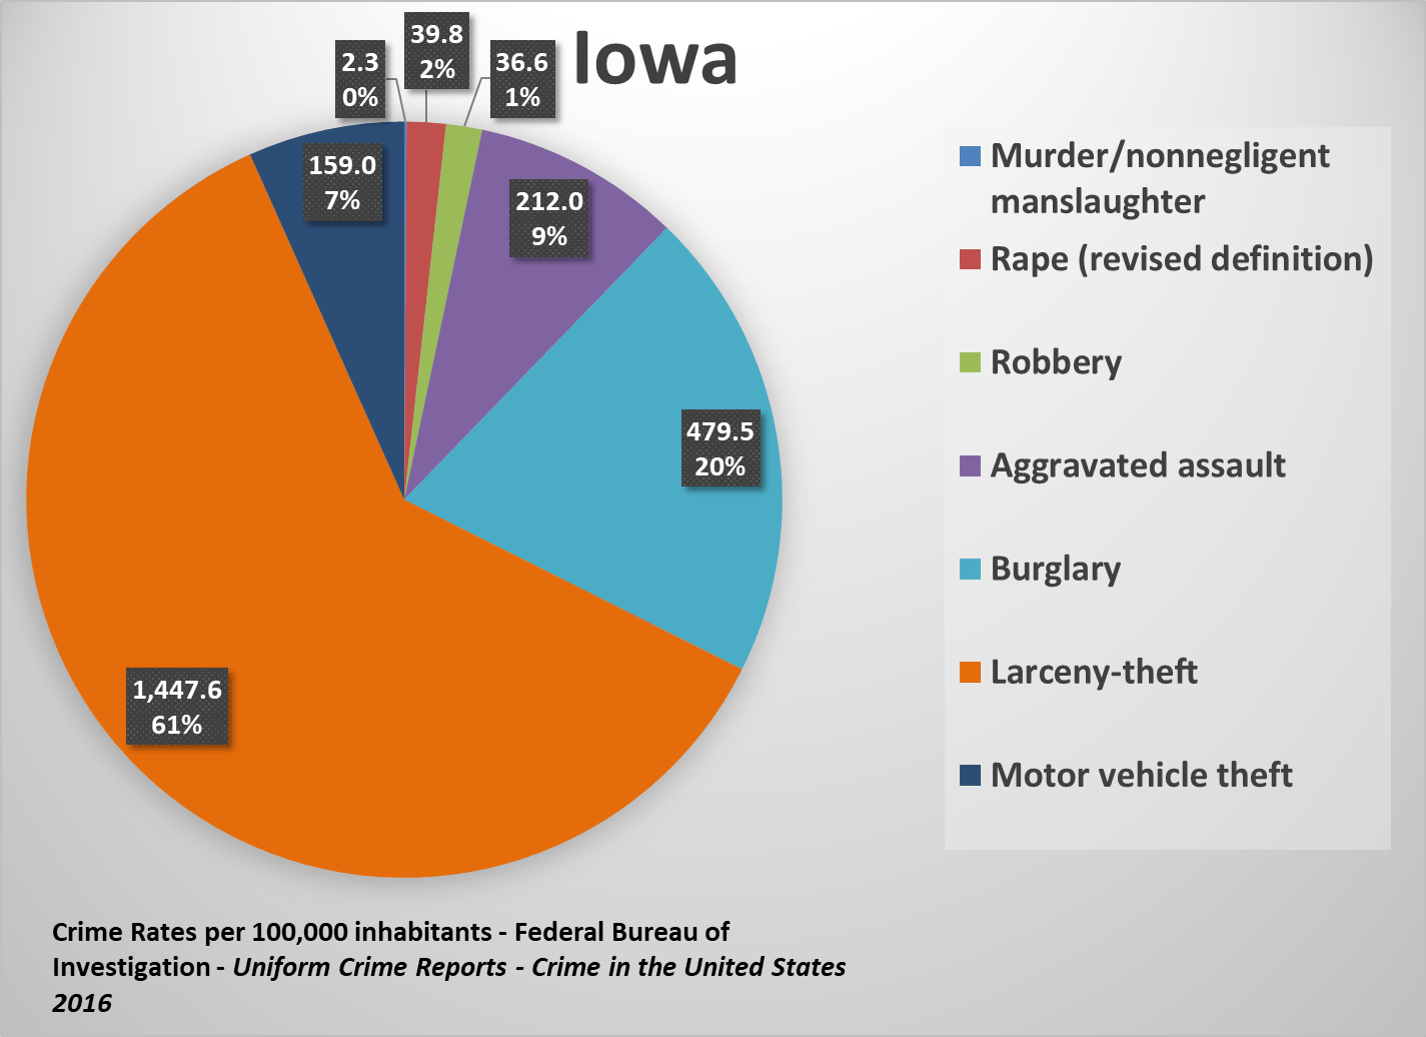
The State of Iowa reported 290.6 violent crimes and 2,086.0 property crimes per 100,000 inhabitants for 2016. Iowa’s violent crime rate is 21.5 percent lower than the national median, and the property crime rate is 19.2 percent lower. Iowa has a similar proportional makeup of crimes by type to the national median, with the exception being that burglary makes up a slightly higher proportion of crime in Iowa (20 percent) than the national median (16 percent).
Kansas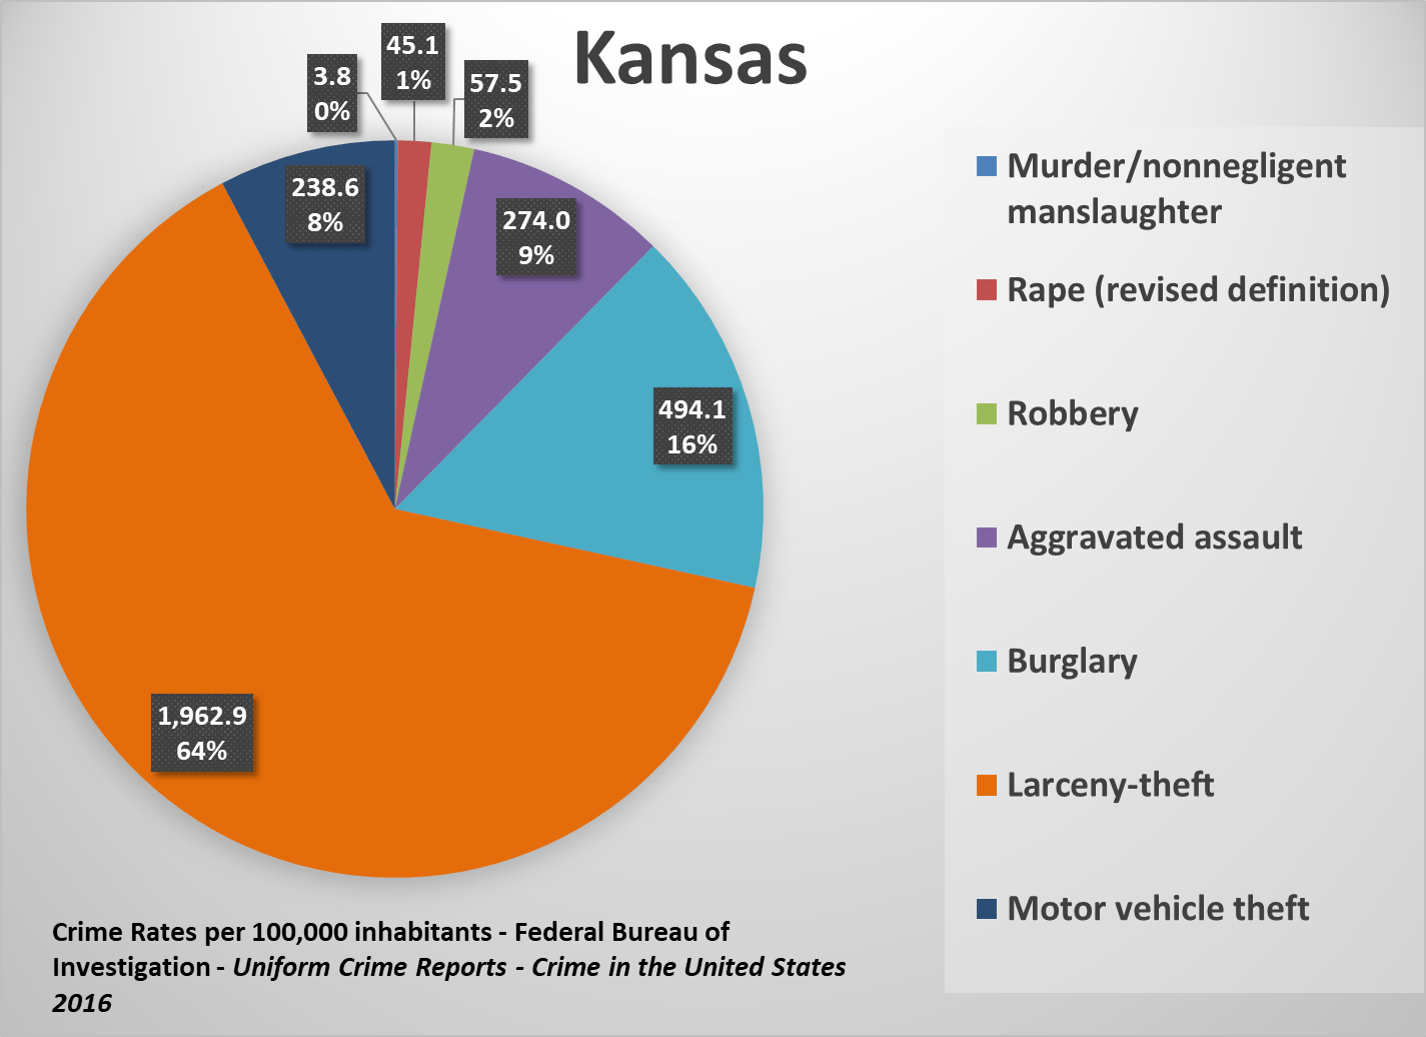
The State of Kansas reported 380.4 violent crimes and 2,695.5 property crimes per 100,000 inhabitants for 2016. Kansas’ violent crime rate is 2.7 percent higher than the national median, and the property crime rate is 4.4 percent higher. Kansas has a similar proportional makeup of crimes by type to the national median.
Kentucky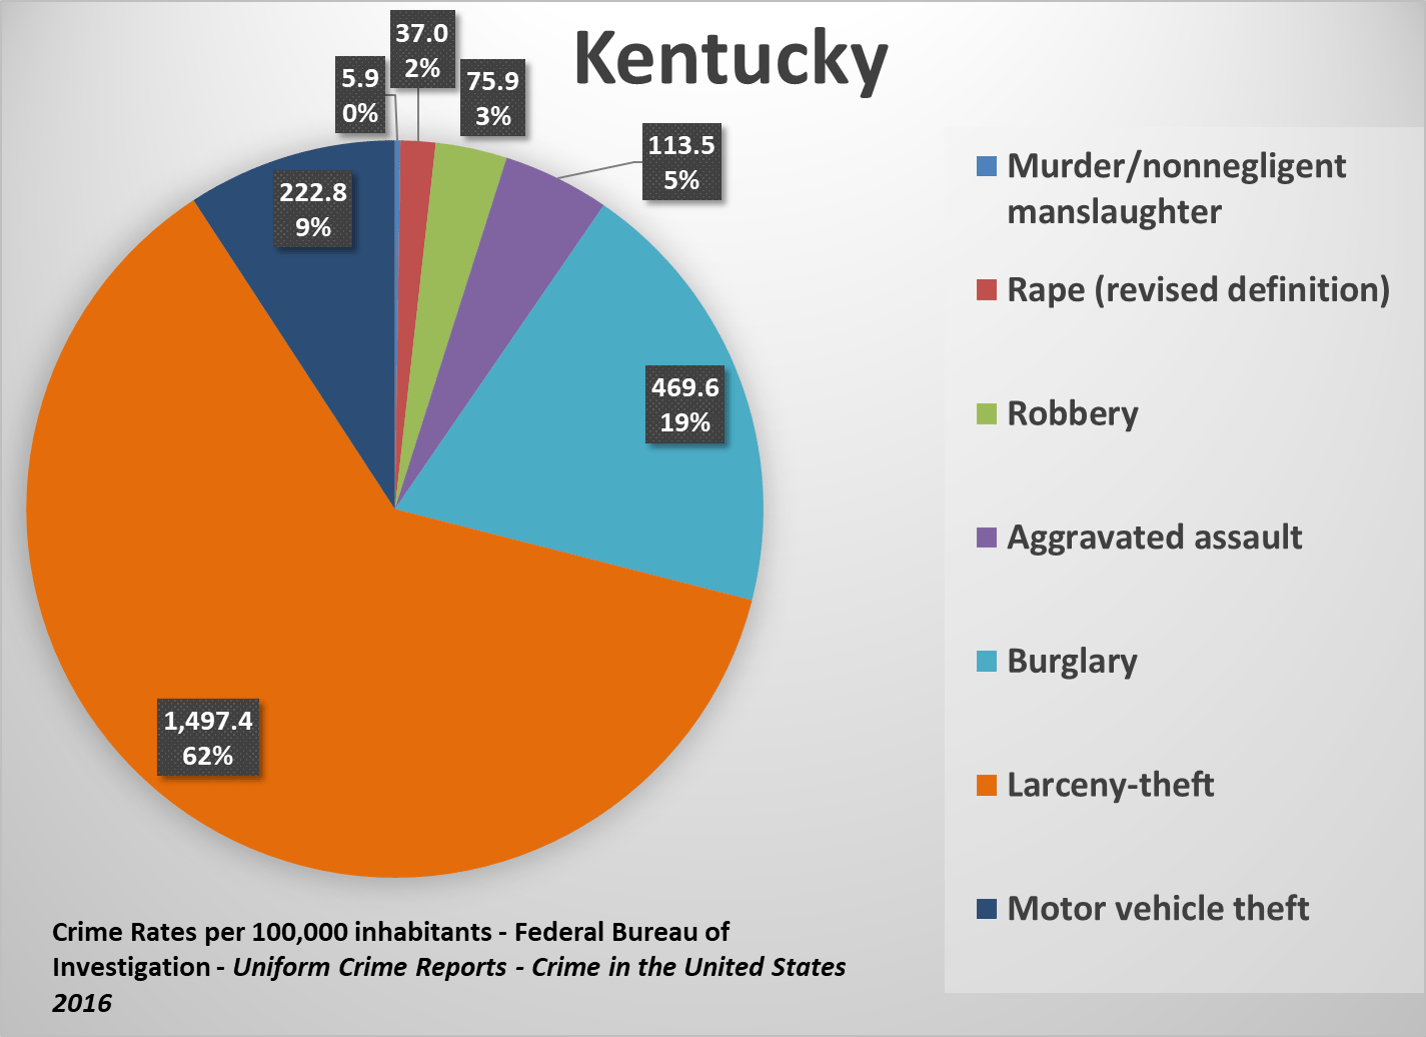
The State of Kentucky reported 232.3 violent crimes and 2,189.7 property crimes per 100,000 inhabitants for 2016. Kentucky’s violent crime rate is 37.3 percent lower than the national median, and the property crime rate is 15.2 percent lower. Kentucky has a similar proportional makeup of crimes by type to the national median.
Louisiana
The State of Louisiana reported 566.1 violent crimes and 3,297.7 property crimes per 100,000 inhabitants for 2016. Louisiana’s violent crime rate is 52.9 percent higher than the national median, and the property crime rate is 27.7 percent higher. Louisiana has a similar proportional makeup of crimes by type to the national median.
Maine
The State of Maine reported 123.8 violent crimes and 1,645.7 property crimes per 100,000 inhabitants for 2016. Maine’s violent crime rate is 66.6 percent lower than the national median. Especially notable is the very lower murder/non-negligent manslaughter rate of 1.5 per 100,000 inhabitants. The property crime rate is 36.3 percent lower. The makeup of crime in Maine shows that larceny-theft makes up a much larger portion of overall crime (73 percent) than the national median (63 percent).
Maryland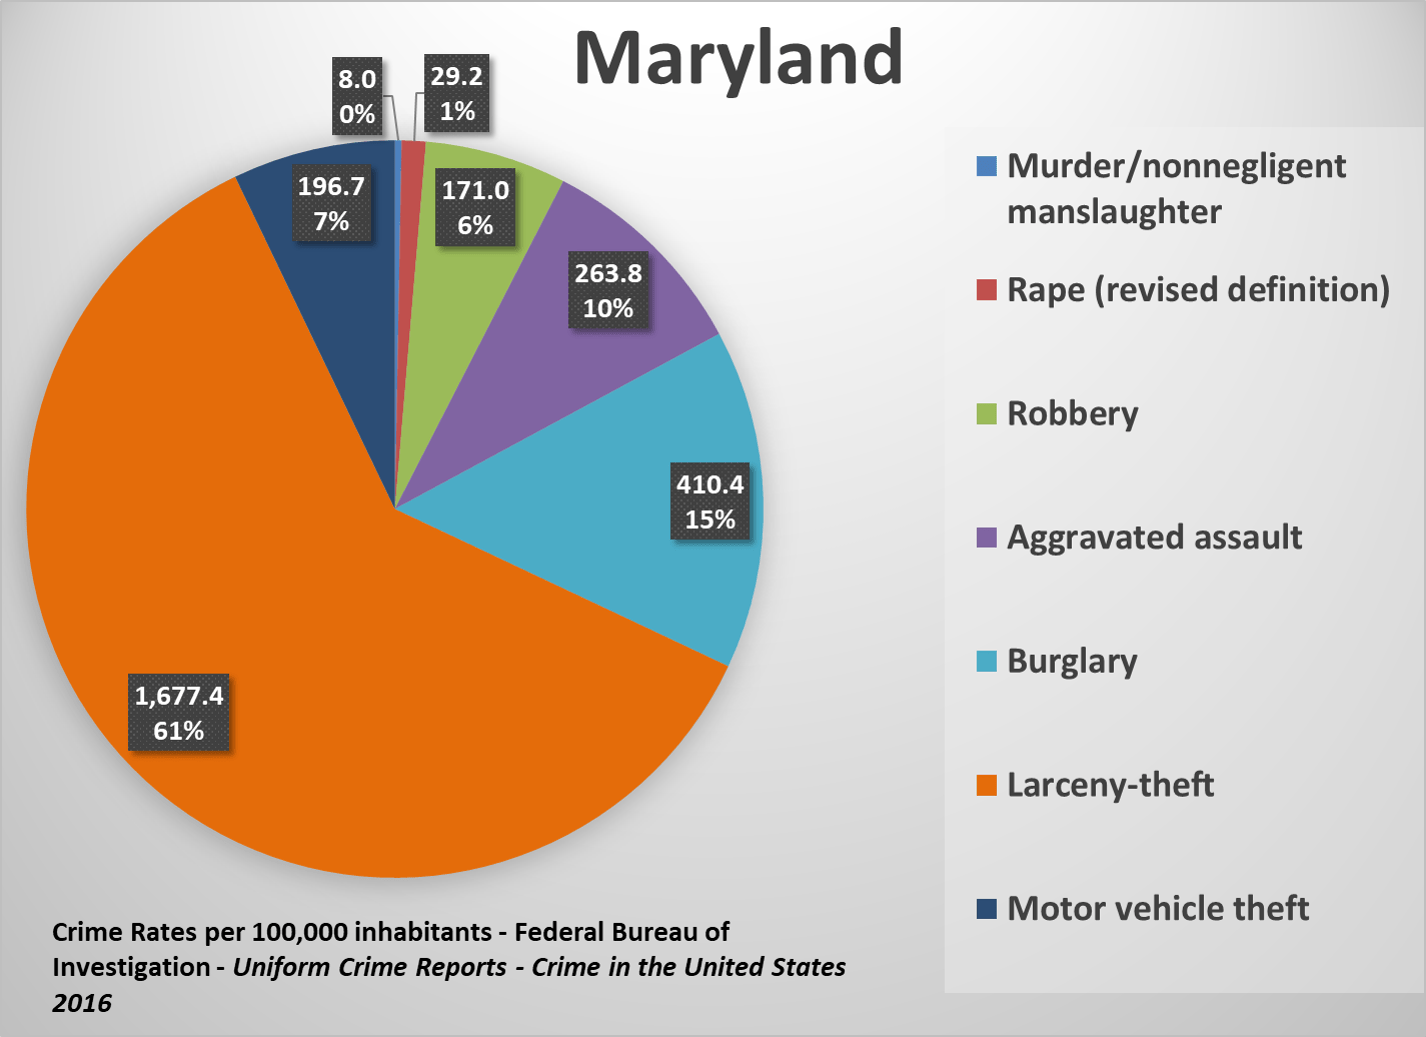
The State of Maryland reported 472.0 violent crimes and 2,284.5 property crimes per 100,000 inhabitants for 2016. Maryland’s violent crime rate is 27.5 percent higher than the national median, and the property crime rate is 11.5 percent lower. Maryland has a similar proportional makeup of crimes by type to the national median.
Massachusetts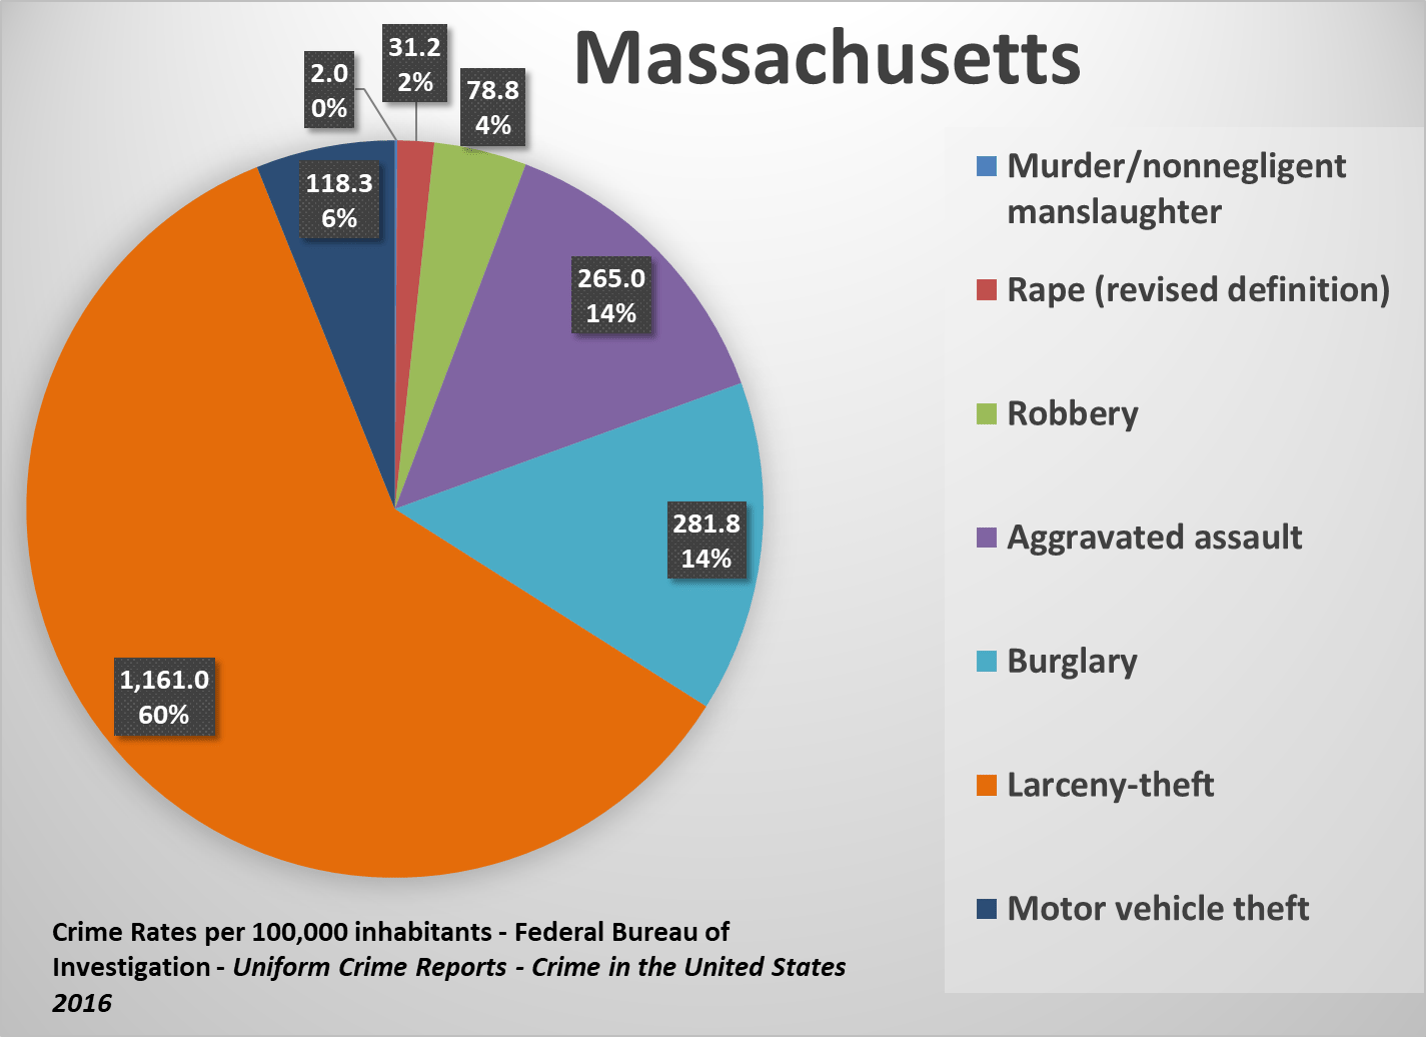
The State of Massachusetts reported 376.9 violent crimes and 1,561.1 property crimes per 100,000 inhabitants for 2016. Massachusetts’ violent crime rate is 1.8 percent higher than the national median, and the property crime rate is 39.5 percent lower. Massachusetts has a similar proportional makeup of crimes by type to the national median.
Michigan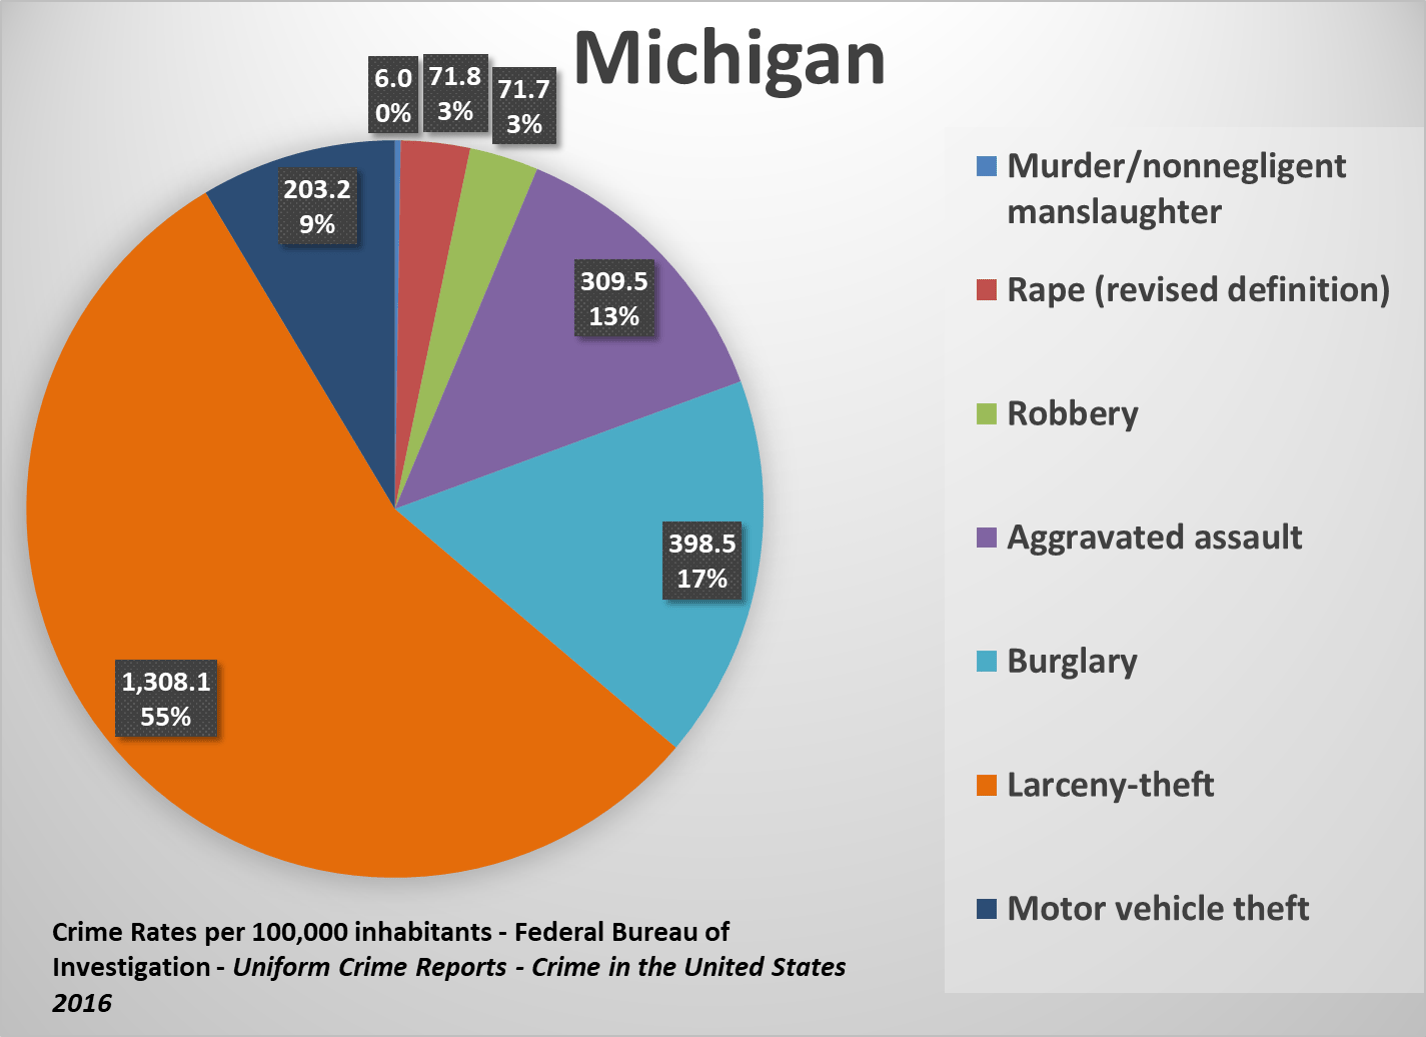
The State of Michigan reported 459.0 violent crimes and 1,909.9 property crimes per 100,000 inhabitants for 2016. Michigan’s violent crime rate is 24.0 percent higher than the national median, and the property crime rate is 26.0 percent lower. Michigan has larceny as a smaller proportion of overall crime (55 percent) than the national median (63 percent).
Minnesota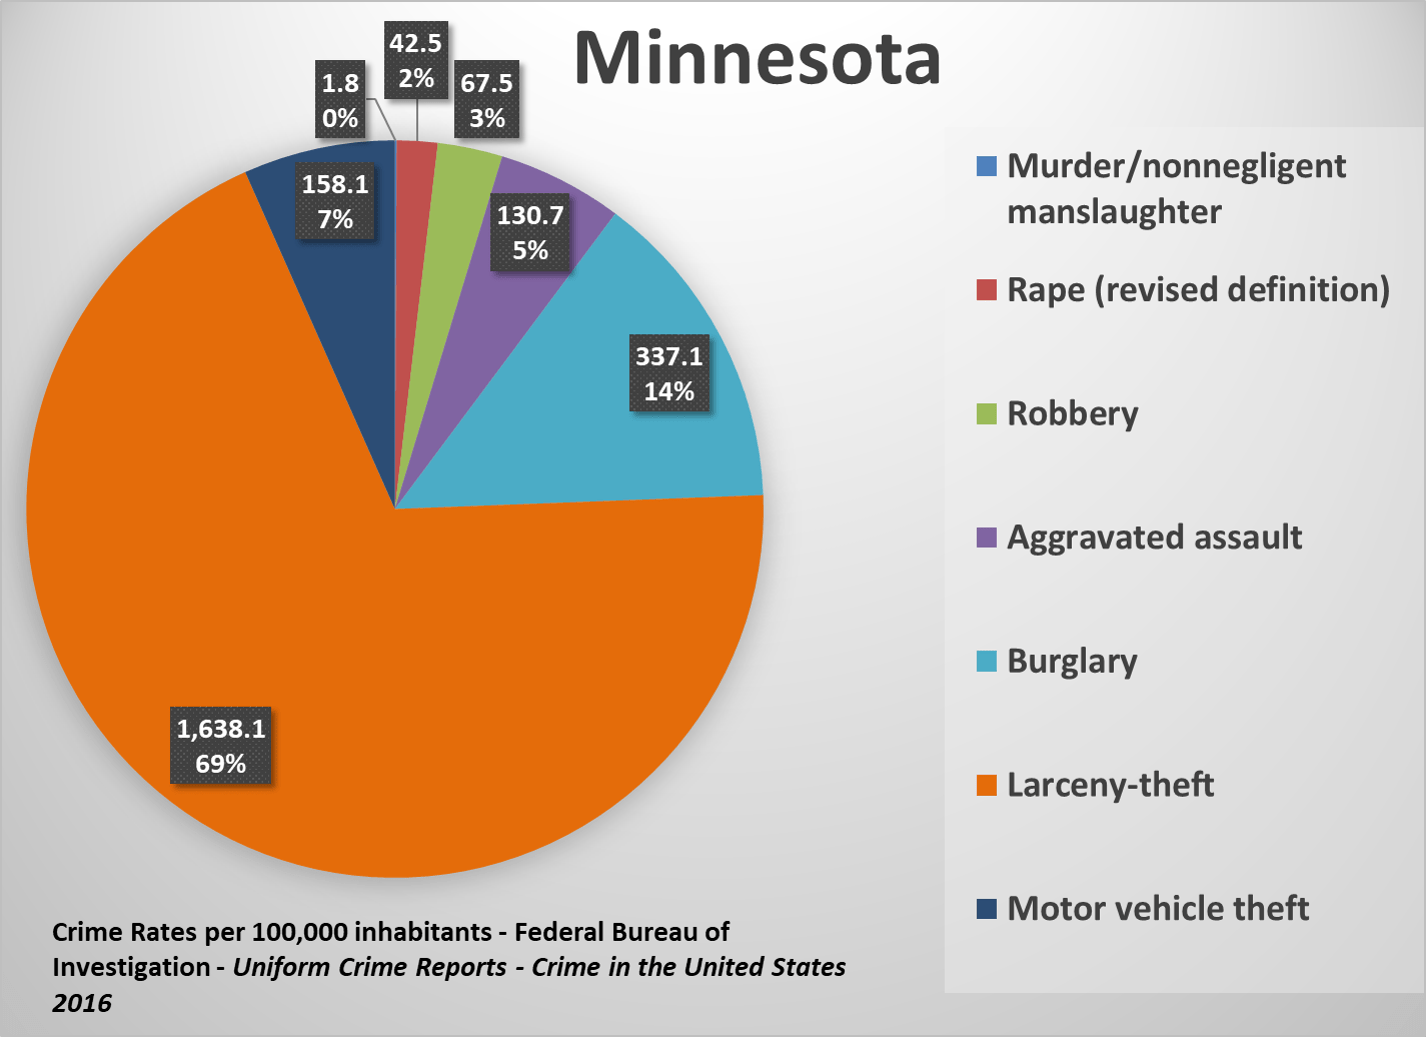
The State of Minnesota reported 242.6 violent crimes and 2,133.3 property crimes per 100,000 inhabitants for 2016. Minnesota’s violent crime rate is 35.4 percent lower than the national median, and the property crime rate is 17.4 percent lower. Larceny-theft is a larger proportion of overall crime in Minnesota (69 percent) than the national median (63 percent).
Mississippi
The State of Mississippi reported 280.5 violent crimes and 2,768.1 property crimes per 100,000 inhabitants for 2016. Mississippi’s violent crime rate is 24.3 percent lower than the national median, and the property crime rate is 7.2 percent higher. Mississippi has a similar proportional makeup of crimes by type to the national median, with the exception that burglary is a much larger makeup of overall crime (26 percent) than the national median (16 percent).
Missouri
The State of Missouri reported 519.4 violent crimes and 2,799.1 property crimes per 100,000 inhabitants for 2016. Missouri’s violent crime rate is 40.3 percent higher than the national median, and the property crime rate is 8.4 percent higher. Missouri has a similar proportional makeup of crimes by type to the national median.
Montana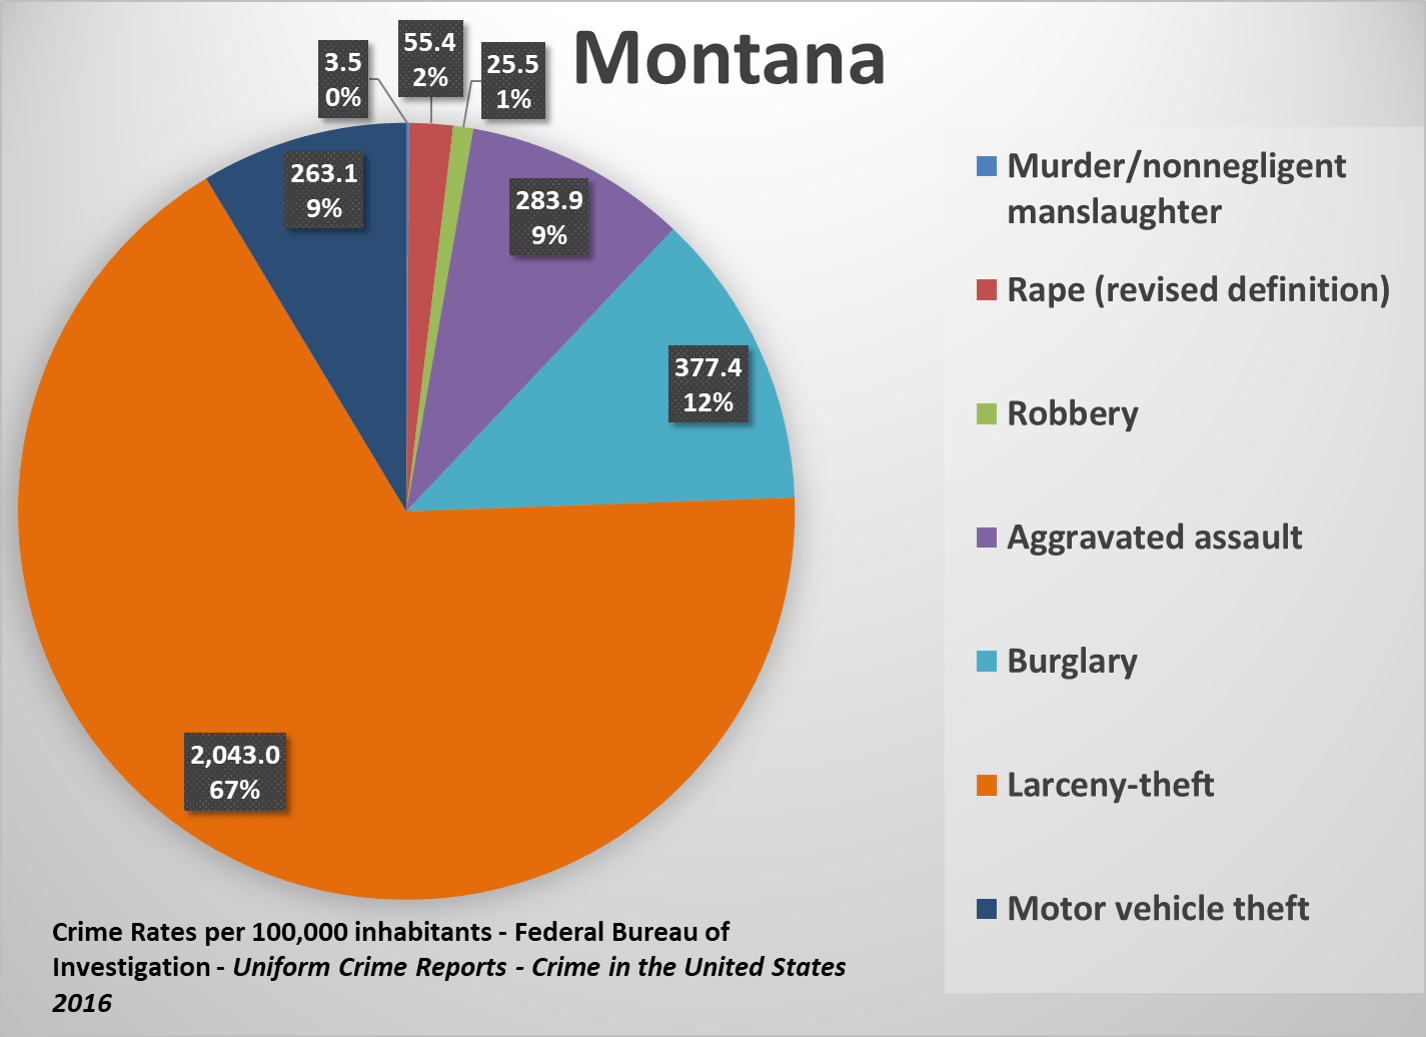
The State of Montana reported 368.3 violent crimes and 2,683.5 property crimes per 100,000 inhabitants for 2016. Montana’s violent crime rate is 0.5 percent lower than the national median, and the property crime rate is 3.9 percent higher. Montana has a similar proportional makeup of crimes by type to the national median.
Nebraska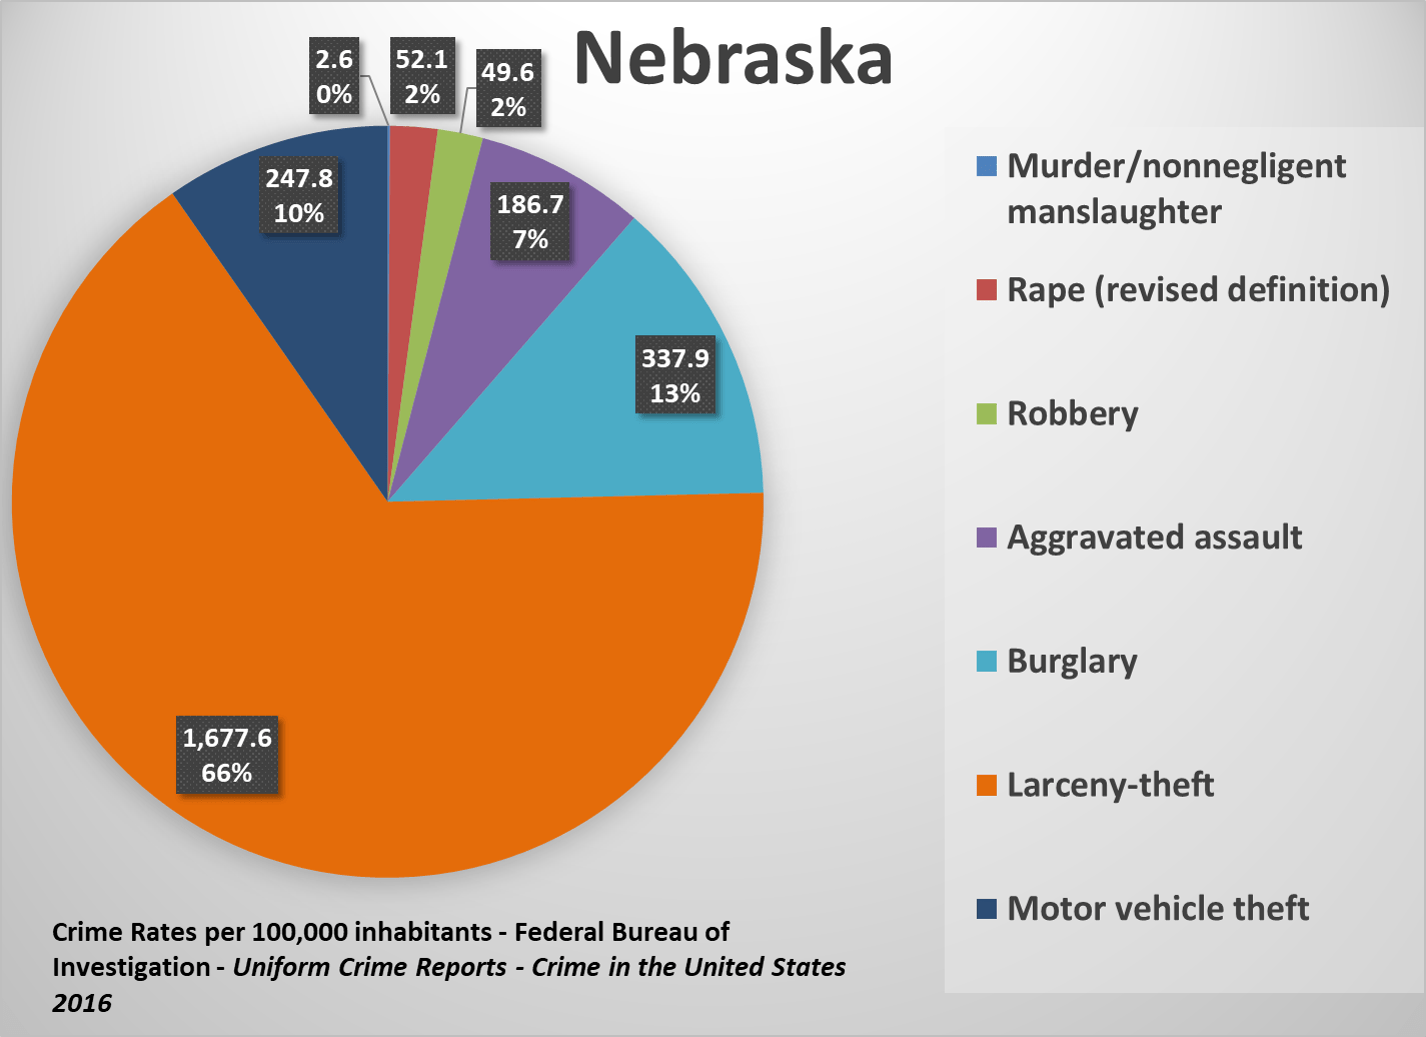
The State of Nebraska reported 291.0 violent crimes and 2,263.3 property crimes per 100,000 inhabitants for 2016. Nebraska’s violent crime rate is 21.4 percent lower than the national median, and the property crime rate is 12.3 percent lower. Nebraska has a similar proportional makeup of crimes by type to the national median.
Nevada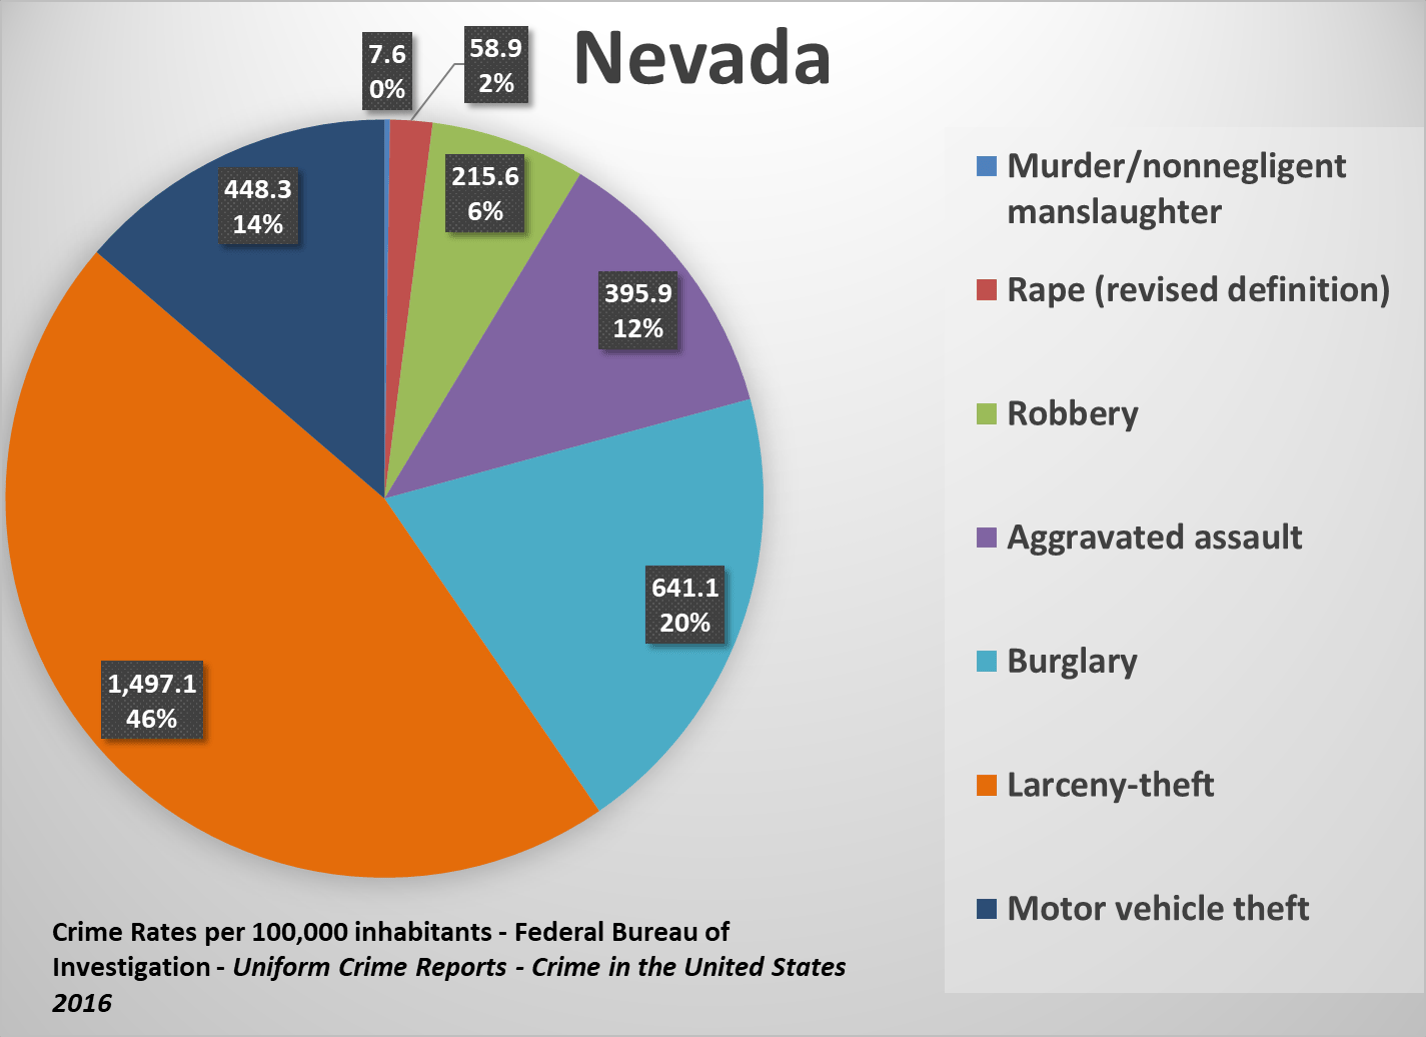
The State of Nevada reported 678.1 violent crimes and 2,586.6 property crimes per 100,000 inhabitants for 2016. Nevada’s violent crime rate is 83.1 percent higher than the national median, and the property crime rate is virtually at the median, being only 0.2 percent higher. Nevada has a much more diverse makeup of crime than the national median. Nationally, larceny-theft makes up 63 percent of overall crime; in Nevada larceny-theft makes up only 46 percent. Burglary (20 percent in Nevada, 16 percent nationally), motor vehicle theft (14 percent to 8 percent), aggravated assault (12 percent to 9 percent), and robbery (6 percent to 3 percent) all makeup a larger proportion of overall crime in Nevada than the national median.
New Hampshire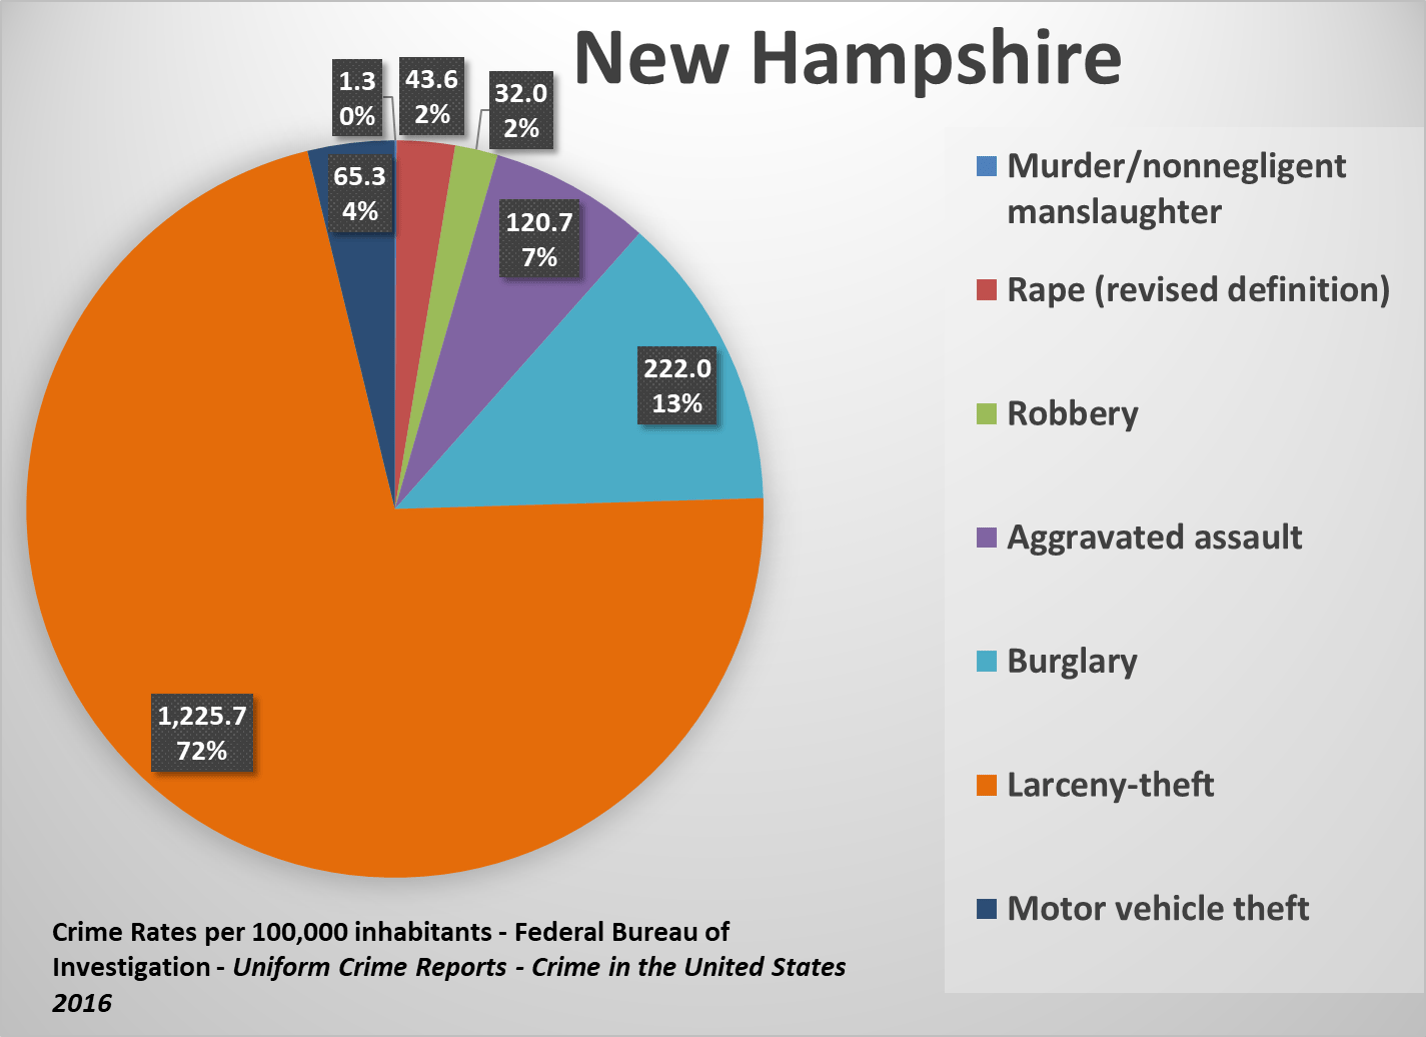
The State of New Hampshire reported 197.6 violent crimes and 1,512.9 property crimes per 100,000 inhabitants for 2016. New Hampshire’s violent crime rate is 46.6 percent lower than the national median, and the property crime rate is 41.4 percent lower. Larceny-theft makes up a much larger part of all crimes in New Hampshire (72 percent) than nationally (63 percent) while motor vehicle theft (4 percent) is much lower (8 percent).
New Jersey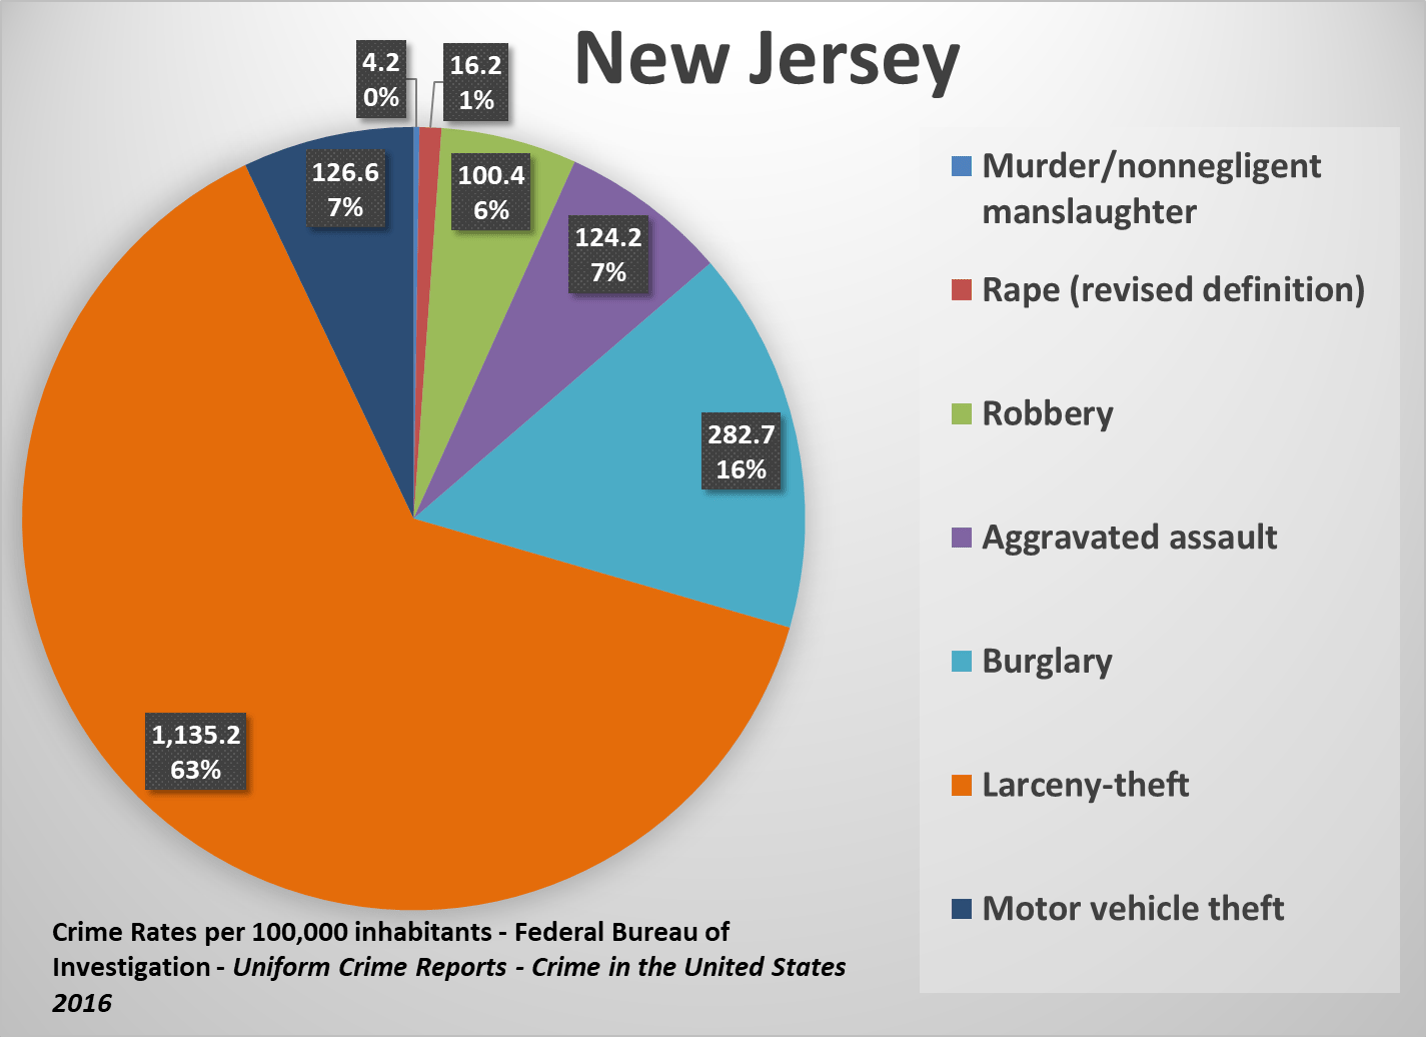
The State of New Jersey reported 245.0 violent crimes and 1,544.6 property crimes per 100,000 inhabitants for 2016. New Jersey’s violent crime rate is 33.8 percent lower than the national median, and the property crime rate is 40.2 percent lower. New Jersey has a similar proportional makeup of crimes by type to the national median.
New Mexico
The State of New Mexico reported 702.5 violent crimes and 3,937.1 property crimes per 100,000 inhabitants for 2016. New Mexico’s violent crime rate is 89.7 percent higher than the national median, and the property crime rate is 52.5 percent higher. Larceny-theft makes up only 55 percent of all crime in New Mexico, compared to 63 percent nationally, whereas burglary, motor vehicle theft, and aggravated assault are all a larger proportion in New Mexico than nationally.
New York
The State of New York reported 376.2 violent crimes and 1,545.6 property crimes per 100,000 inhabitants for 2016. New York’s violent crime rate is 1.6 percent higher than the national median, and the property crime rate is 40.1 percent lower. New York has a similar proportional makeup of crimes by type to the national median, although burglary makes up a somewhat lower proportion of crimes in New York (10 percent) than the national median (16 percent).
North Carolina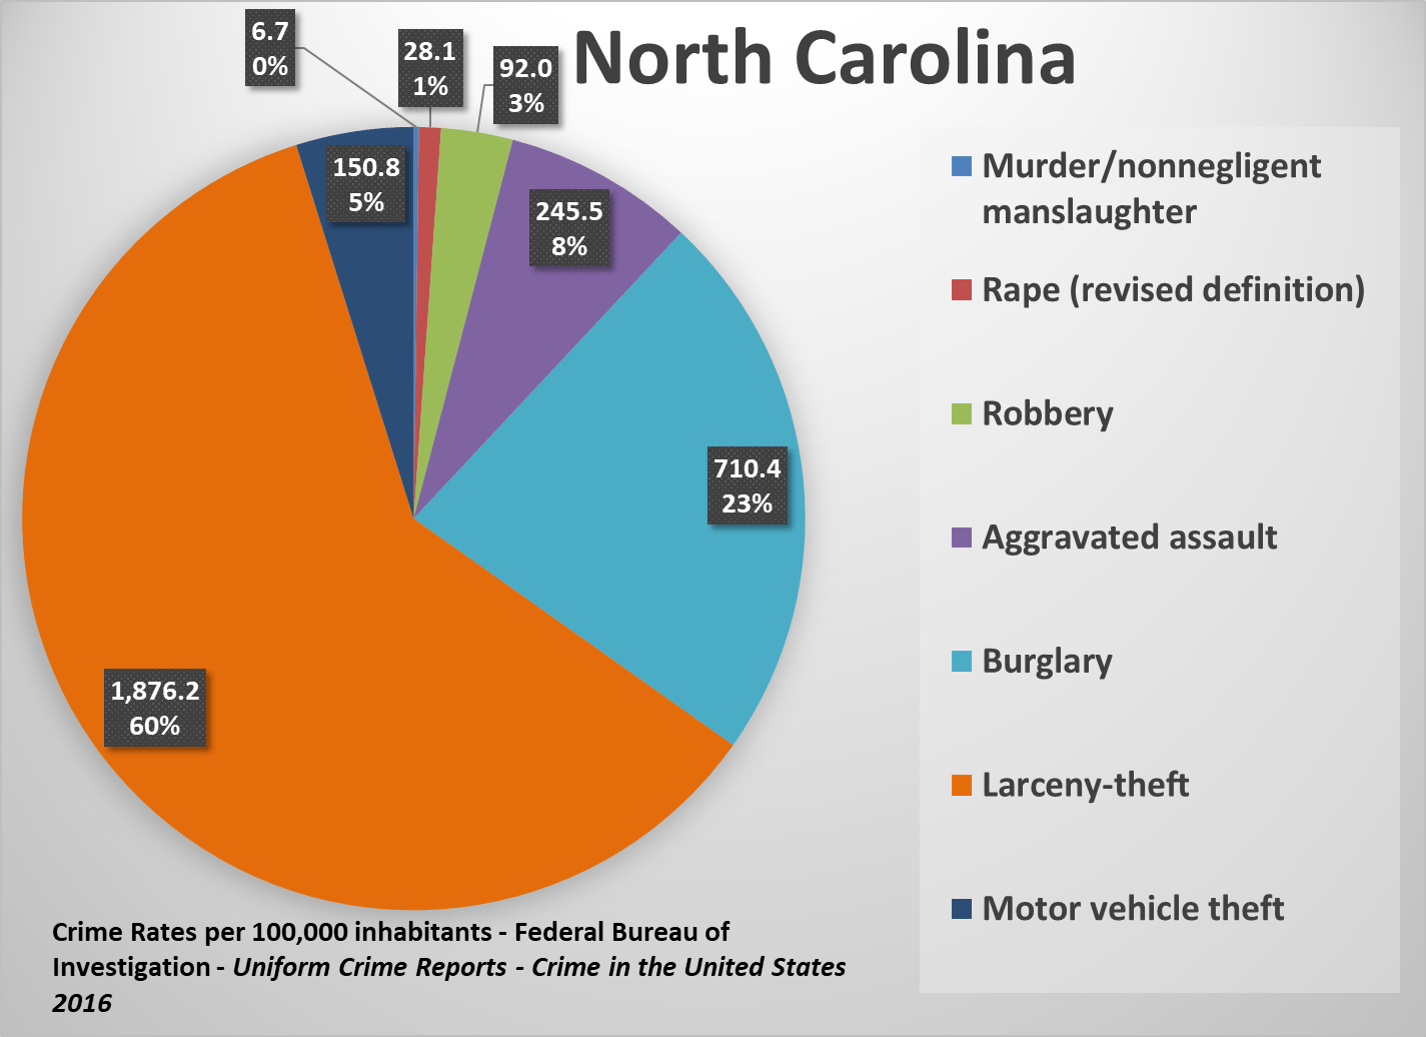
The State of North Carolina reported 372.2 violent crimes and 2,737.5 property crimes per 100,000 inhabitants for 2016. North Carolina’s violent crime rate is 0.5 percent higher than the national median, and the property crime rate is 6.0 percent higher. Burglary makes up a somewhat lower proportion of crimes in North Carolina (23 percent) than the national median (16 percent).
North Dakota
The State of North Dakota reported 251.1 violent crimes and 2,295.9 property crimes per 100,000 inhabitants for 2016. North Dakota’s violent crime rate is 32.2 percent lower than the national median, and the property crime rate is 11.1 percent lower. North Dakota has a similar proportional makeup of crimes by type to the national median.
Ohio
The State of Ohio reported 300.3 violent crimes and 2,577.5 property crimes per 100,000 inhabitants for 2016. Ohio’s violent crime rate is 18.9 percent lower than the national median, and the property crime rate is 0.2 percent lower. Ohio has a similar proportional makeup of crimes by type to the national median.
Oklahoma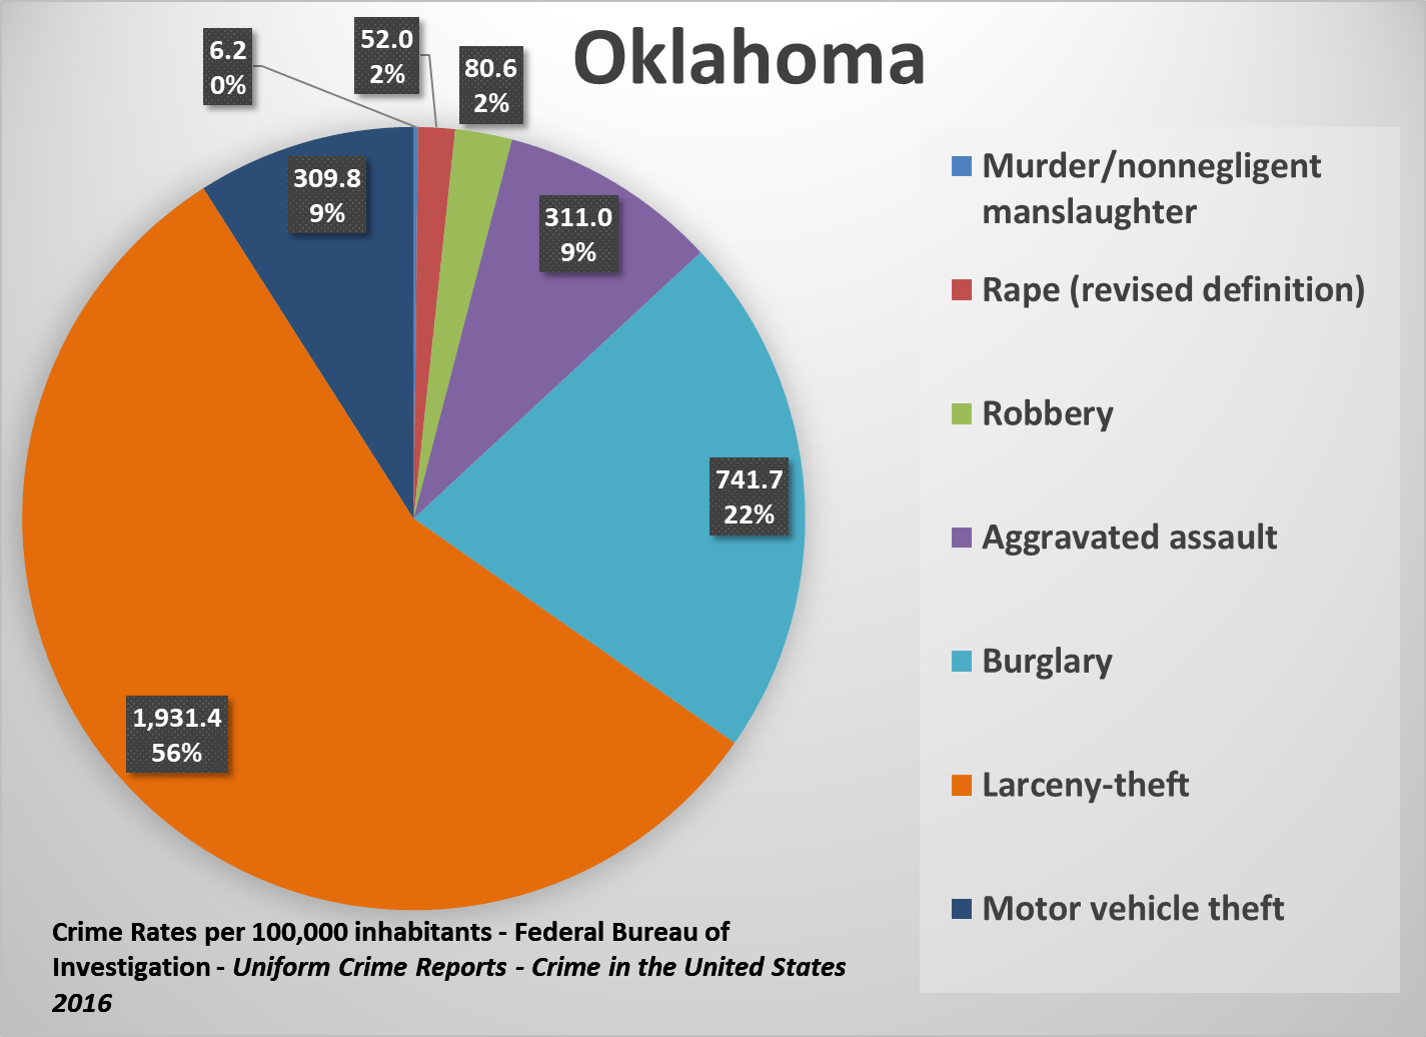
The State of Oklahoma reported 449.8 violent crimes and 2,982.9 property crimes per 100,000 inhabitants for 2016. Oklahoma’s violent crime rate is 21.5 percent higher than the national median, and the property crime rate is 15.5 percent higher. Larceny-theft is a less common crime relative to other crimes in Oklahoma (56 percent) than nationally (63 percent), while burglary (22 percent) is more common than nationally (16 percent).
Oregon
The State of Oregon reported 264.6 violent crimes and 2,964.4 property crimes per 100,000 inhabitants for 2016. Oregon’s violent crime rate is 28.5 percent lower than the national median, and the property crime rate is 14.8 percent higher. Oregon has a similar proportional makeup of crimes by type to the national median, with larceny-theft being slightly more common in Oregon relative to other crimes (69 percent) then is the case nationally (63 percent).
Pennsylvania
The State of Pennsylvania reported 316.4 violent crimes and 1,742.7 property crimes per 100,000 inhabitants for 2016. Pennsylvania’s violent crime rate is 14.6 percent lower than the national median, and the property crime rate is 32.5 percent lower. Pennsylvania has a similar proportional makeup of crimes by type to the national median.
Puerto Rico
The Commonwealth of Puerto Rico reported 224.0 violent crimes and 1,031.9 property crimes per 100,000 inhabitants for 2016. Puerto Rico’s violent crime rate is 39.5 percent lower than the national median, and the property crime rate is 60.0 percent lower. Puerto Rico has a notably lower portion of crime committed that is classified as larceny-theft (54 percent) than nationally (63 percent). Murder-non-negligent manslaughter is two percent of crime in Puerto Rico, and the rate of 19.9 percent per 100,000 inhabitants is far above the national median (5.3 per 100,000 inhabitants).
Rhode Island
The State of Rhode Island reported 238.9 violent crimes and 1,898.7 property crimes per 100,000 inhabitants for 2016. Rhode Island’s violent crime rate is 35.5 percent lower than the national median, and the property crime rate is 26.5 percent lower. Rhode Island has a similar proportional makeup of crimes by type to the national median.
South Carolina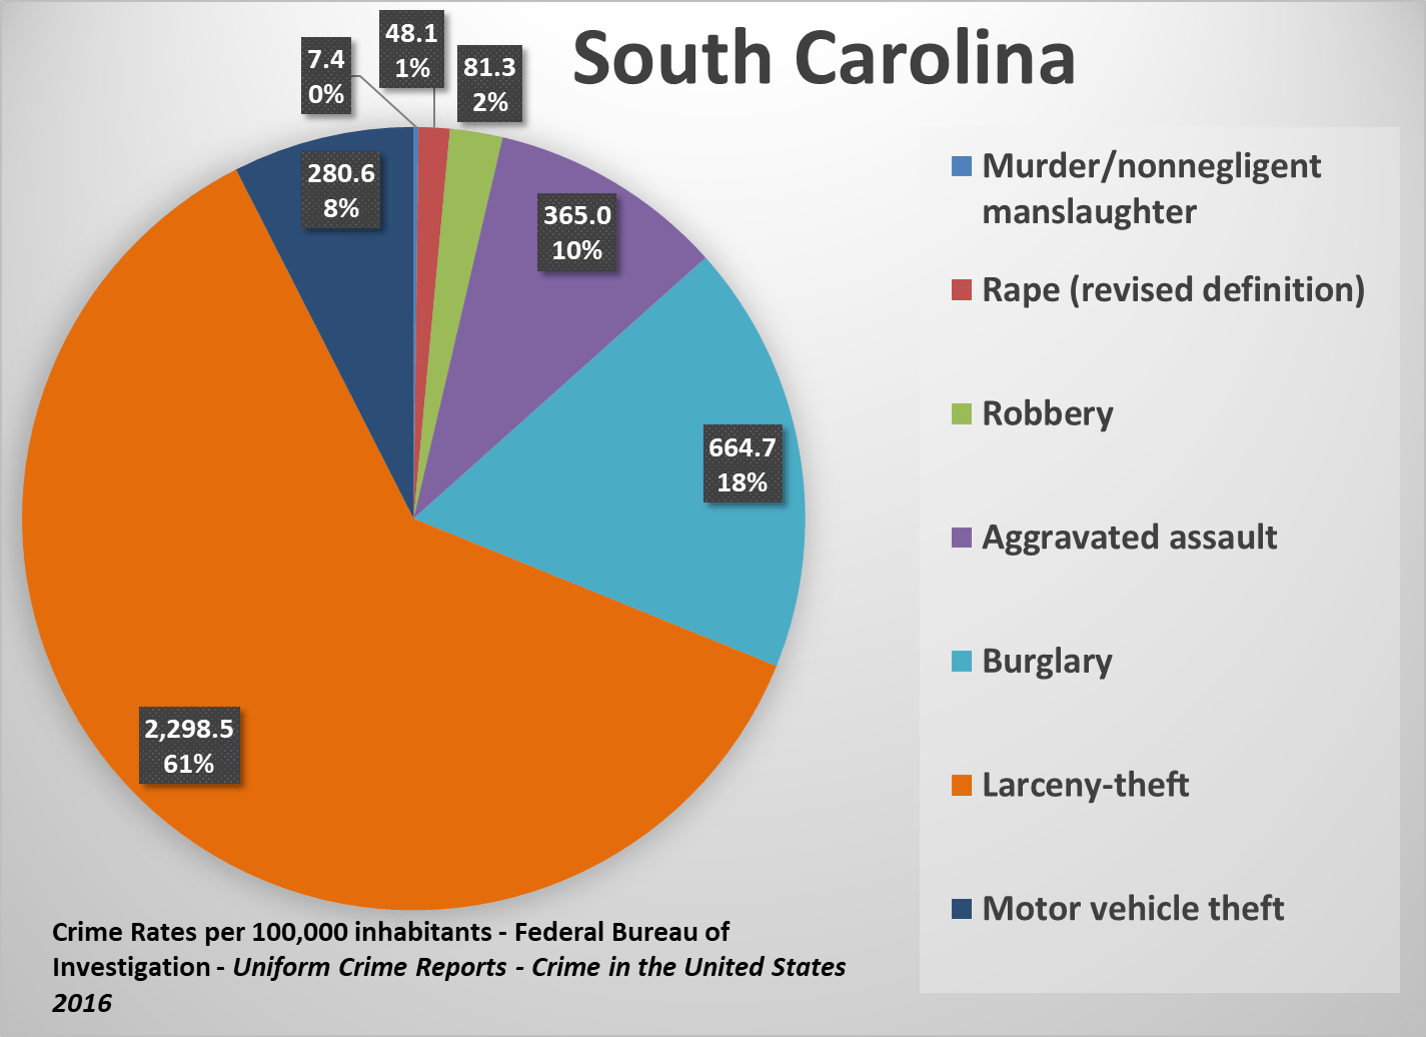
The State of South Carolina reported 501.8 violent crimes and 3,243.8 property crimes per 100,000 inhabitants for 2016. South Carolina’s violent crime rate is 35.5 percent higher than the national median, and the property crime rate is 25.6 percent higher. South Carolina has a similar proportional makeup of crimes by type to the national median.
South Dakota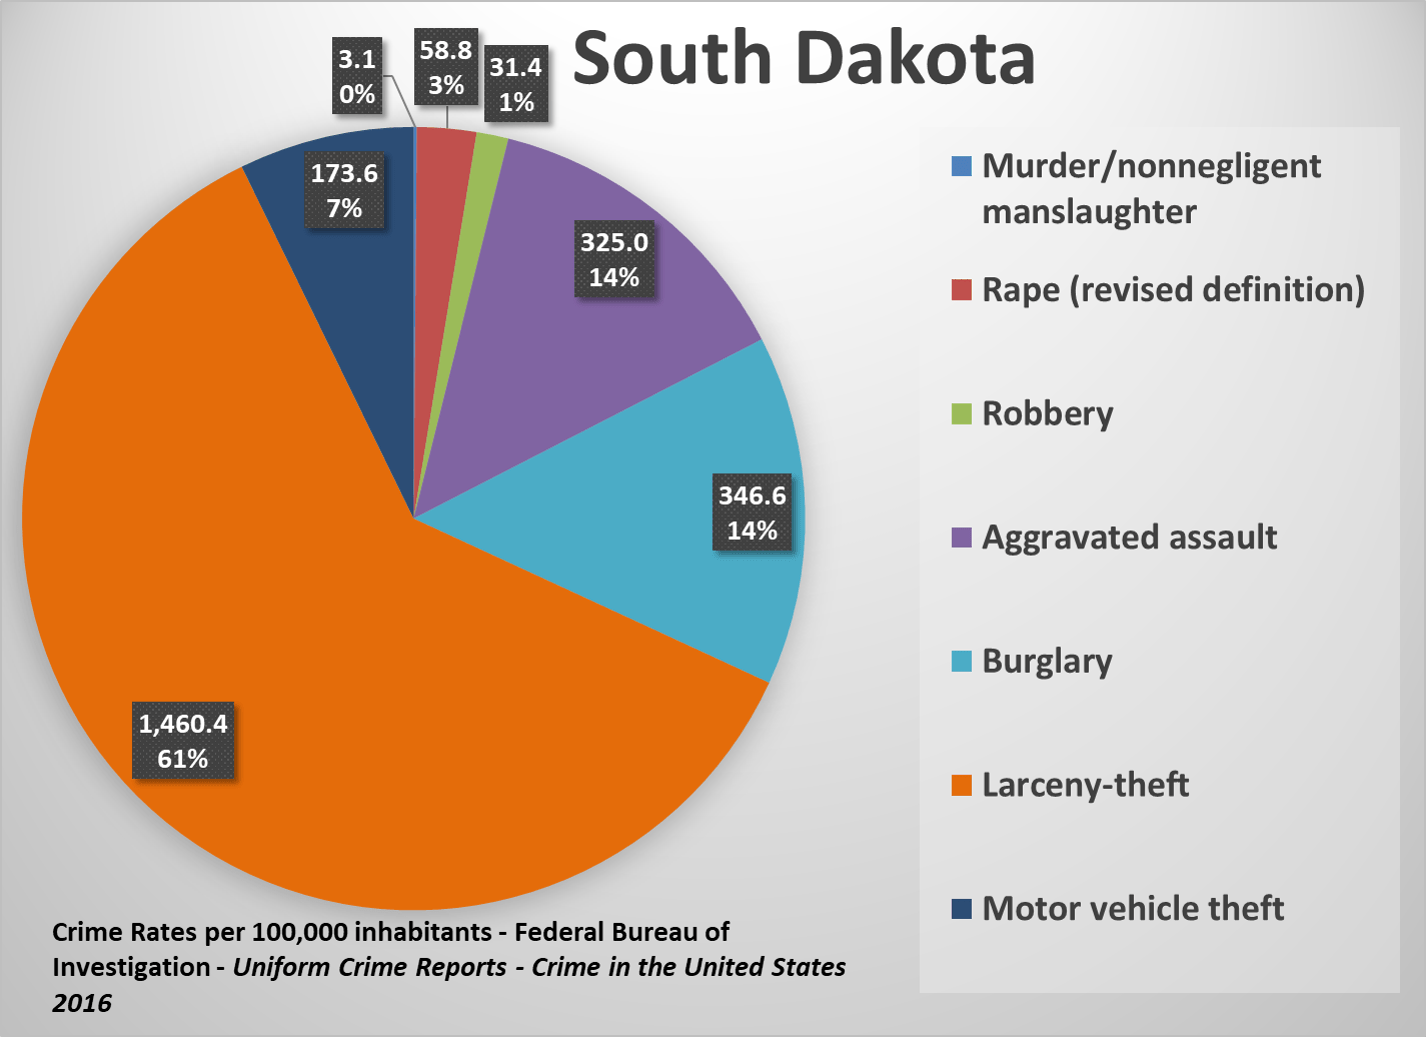
The State of South Dakota reported 418.4 violent crimes and 1,980.6 property crimes per 100,000 inhabitants for 2016. South Dakota’s violent crime rate is 13.0 percent higher than the national median, and the property crime rate is 23.3 percent higher. South Dakota has a similar proportional makeup of crimes by type to the national median. Aggravated assault makes up a larger proportion of overall crime in South Dakota (14 percent) than the national median (9 percent).
Tennessee
The State of Tennessee reported 632.9 violent crimes and 2,854.1 property crimes per 100,000 inhabitants for 2016. Tennessee’s violent crime rate is 70.9 percent higher than the national median, and the property crime rate is 10.5 percent higher. Larceny-theft makes up a smaller proportion of overall crime in Tennessee (58 percent) than nationally (63 percent), while aggravated assault (14 percent) is higher than the national rate (9 percent).
Texas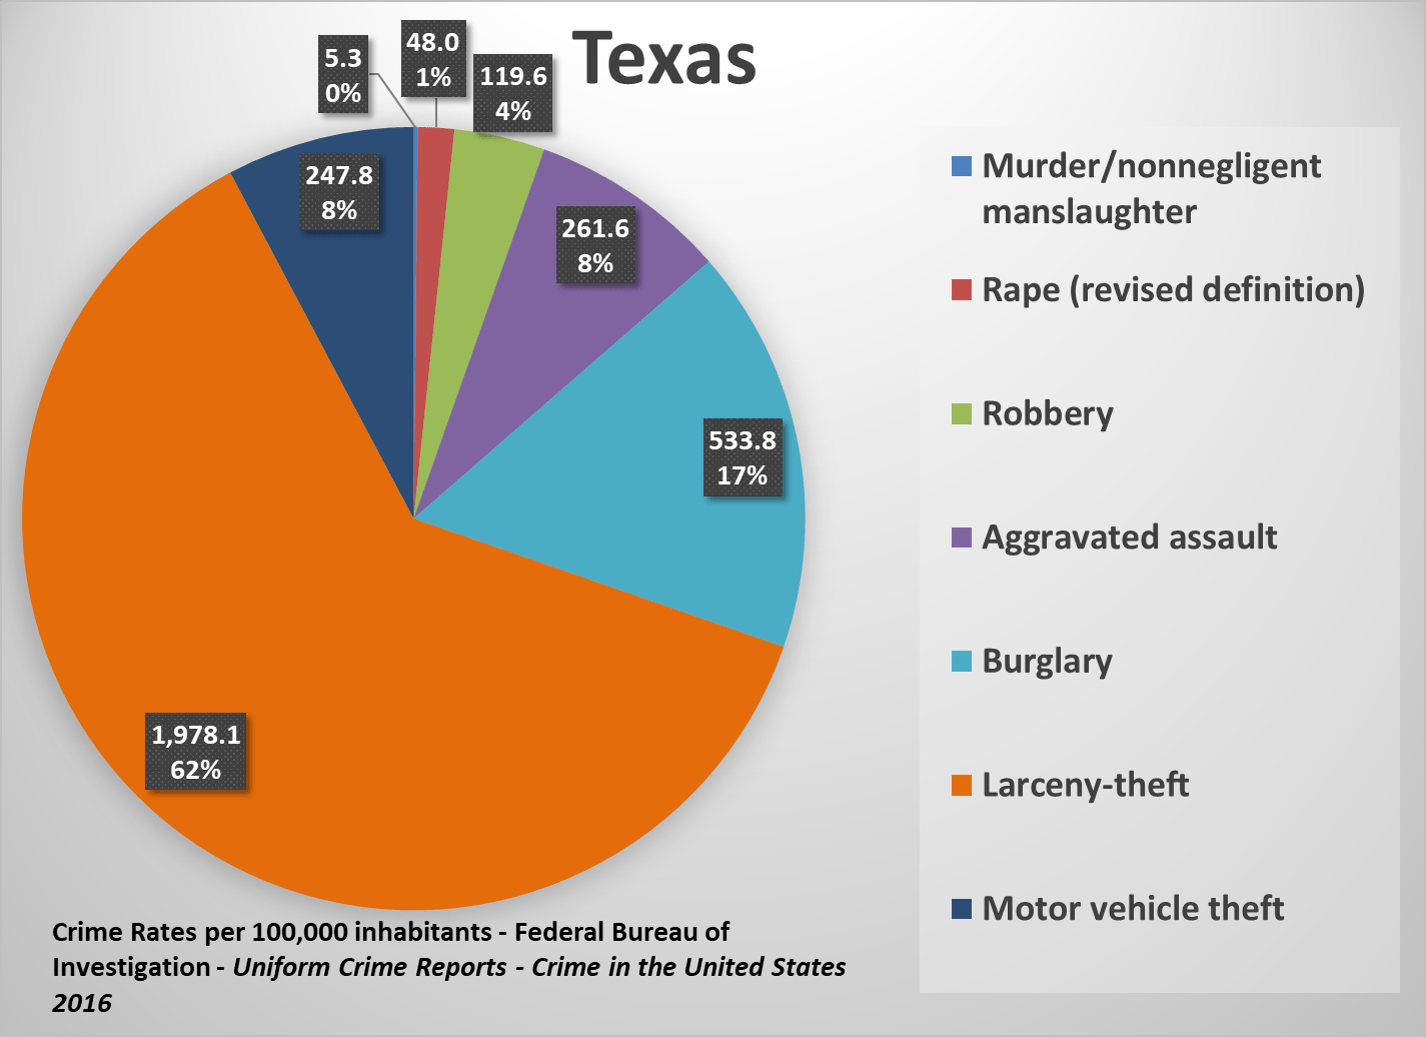
The State of Texas reported 434.4 violent crimes and 2,759.8 property crimes per 100,000 inhabitants for 2016. Texas’s violent crime rate is 17.3 percent higher than the national median, and the property crime rate is 6.9 percent higher. Texas has a similar proportional makeup of crimes by type to the national median.
Utah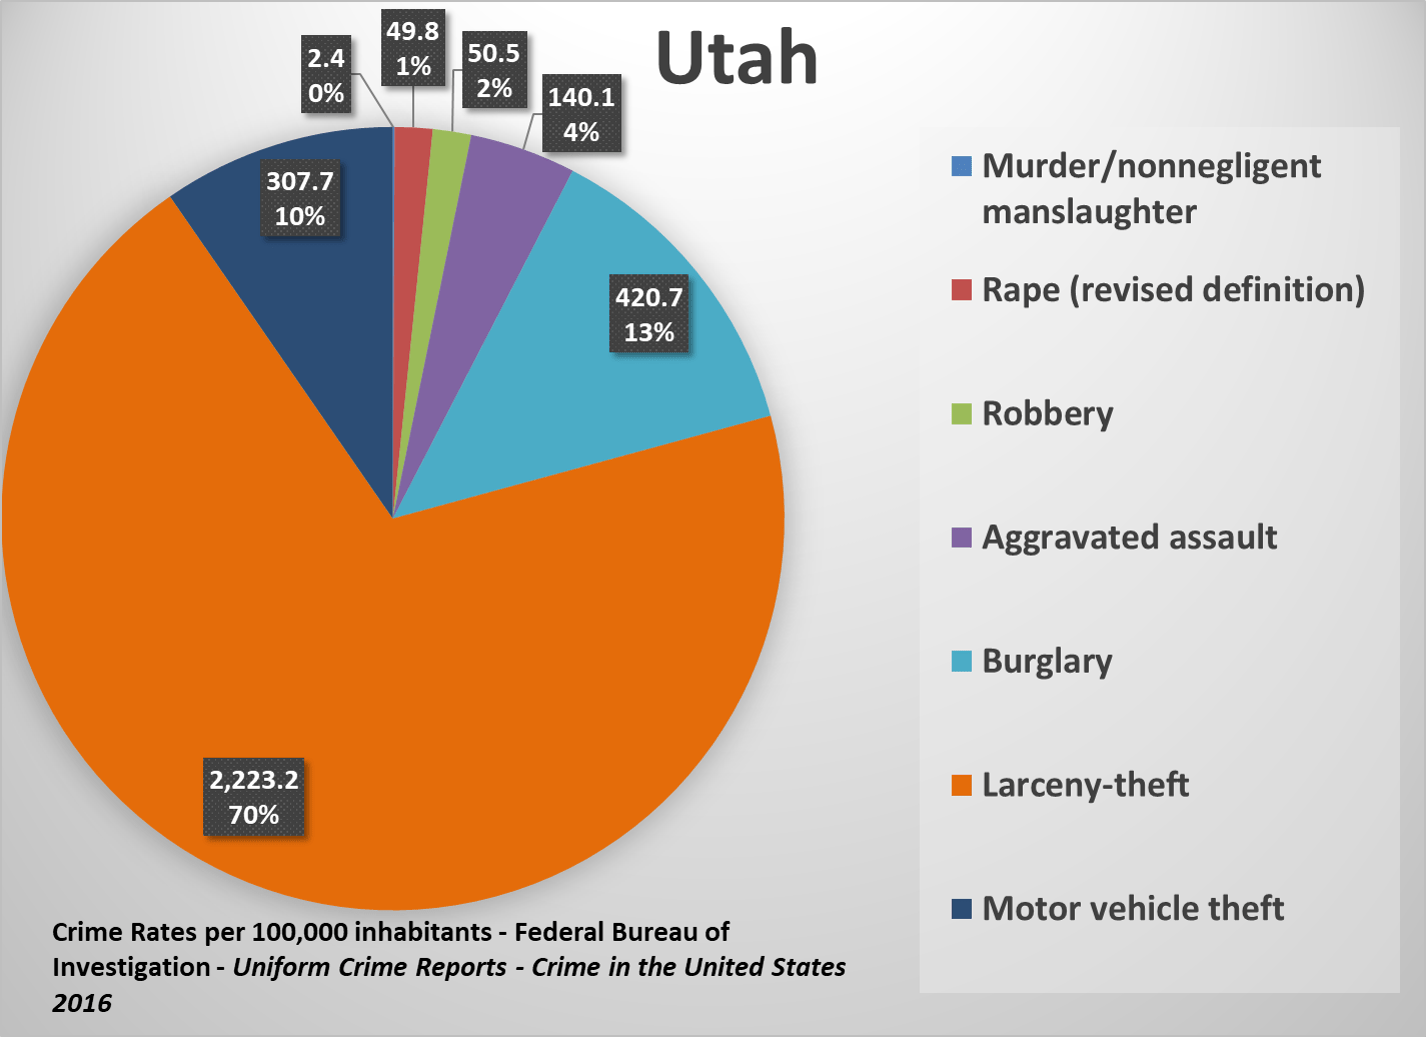
The State of Utah reported 242.8 violent crimes and 2,951.5 property crimes per 100,000 inhabitants for 2016. Utah’s violent crime rate is 34.4 percent lower than the national median, and the property crime rate is 14.3 percent higher. These numbers are reflected in larceny-theft making up a larger proportion of overall crime in Utah (70 percent) than nationally (63 percent), while aggravated assault is a smaller proportion in Utah (4 percent) than nationally (9 percent).
Vermont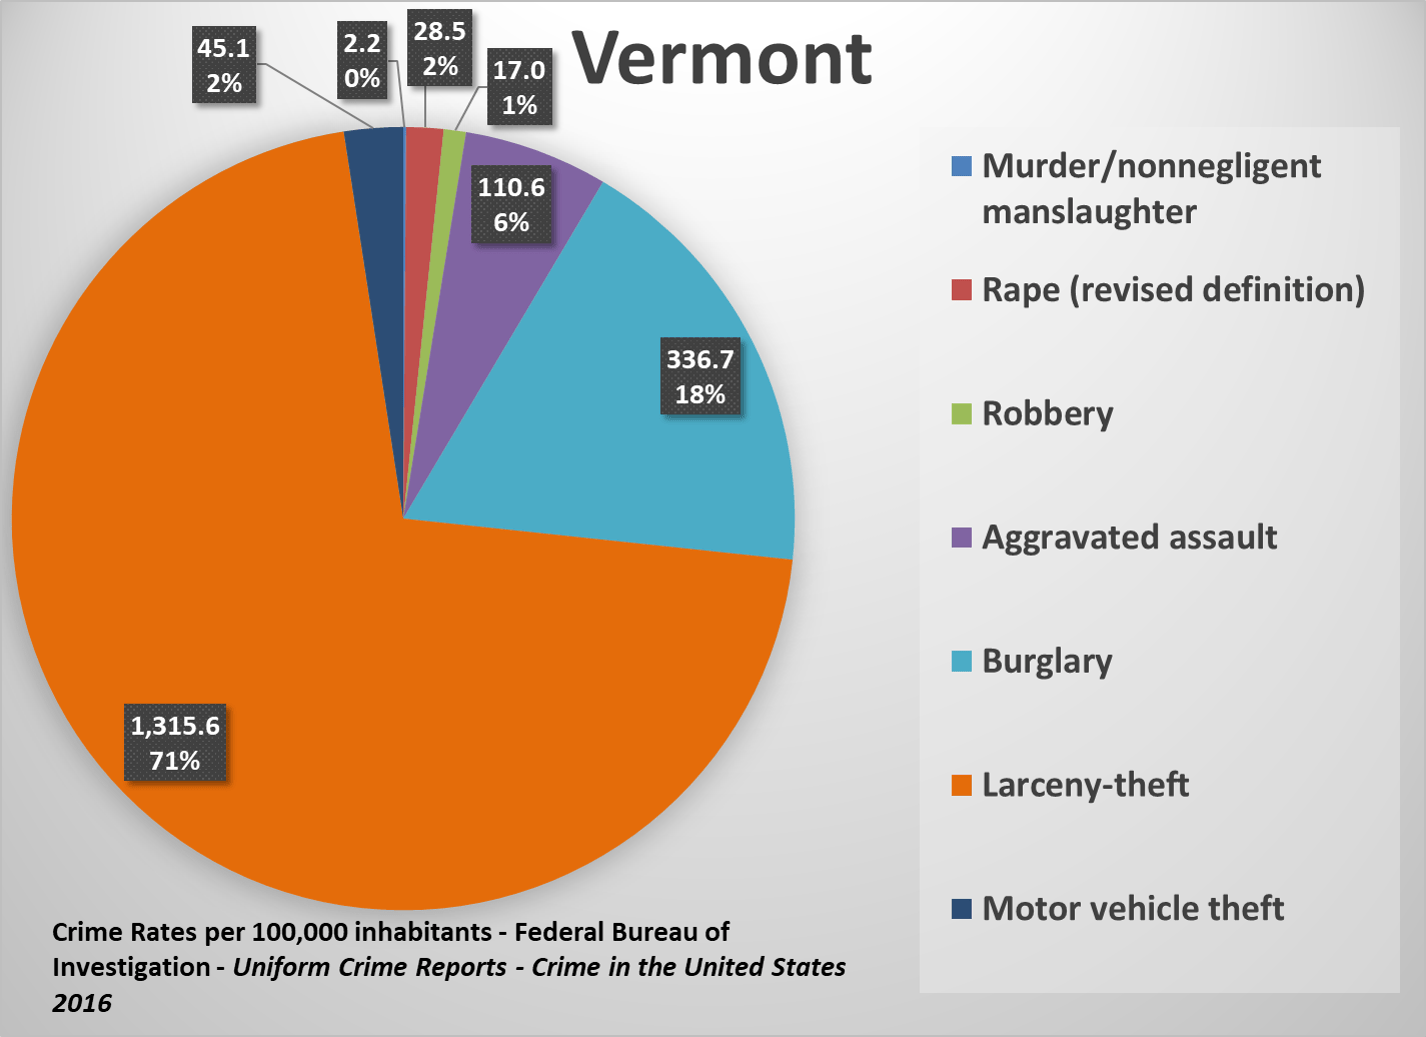
The State of Vermont reported 158.3 violent crimes and 1,697.4 property crimes per 100,000 inhabitants for 2016. Vermont’s violent crime rate is 57.3 percent lower than the national median, and the property crime rate is 34.3 percent lower. Vermont has a mix of crimes dominated by larceny-theft (71 percent) and burglary (18 percent). Motor vehicle theft makes up only two percent of crime in Vermont.
Virginia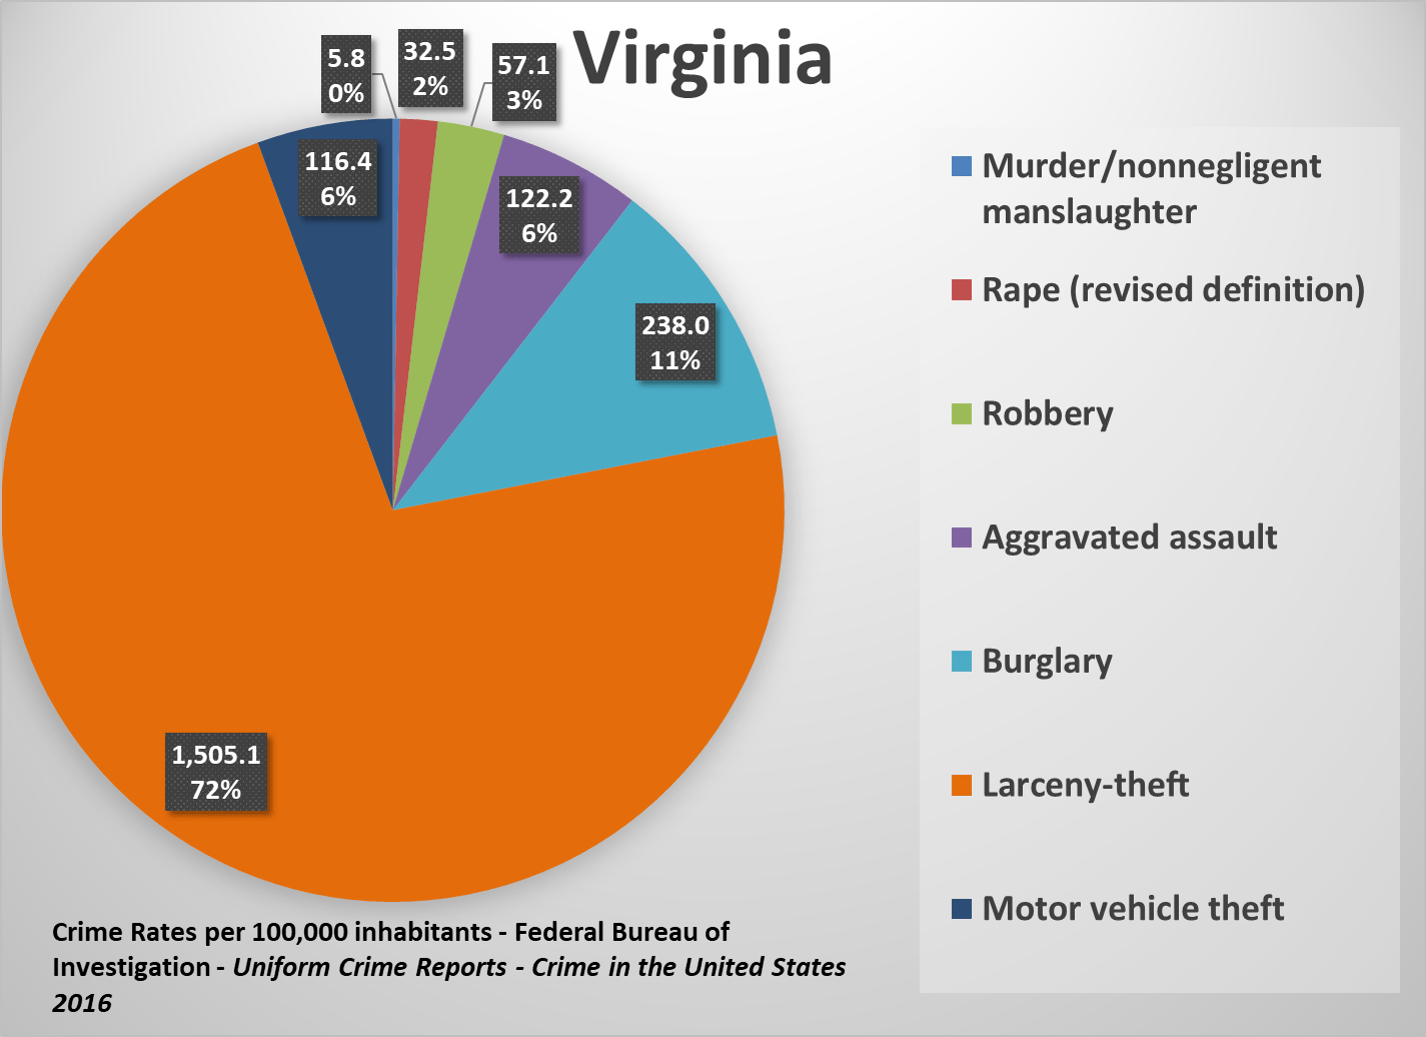
The State of Virginia reported 217.6 violent crimes and 1,859.4 property crimes per 100,000 inhabitants for 2016. Virginia’s violent crime rate is 41.2 percent lower than the national median, and the property crime rate is 28.0 percent lower. Larceny-theft is a larger proportion of overall crime in Virginia (72 percent) than the national median (63 percent).
Washington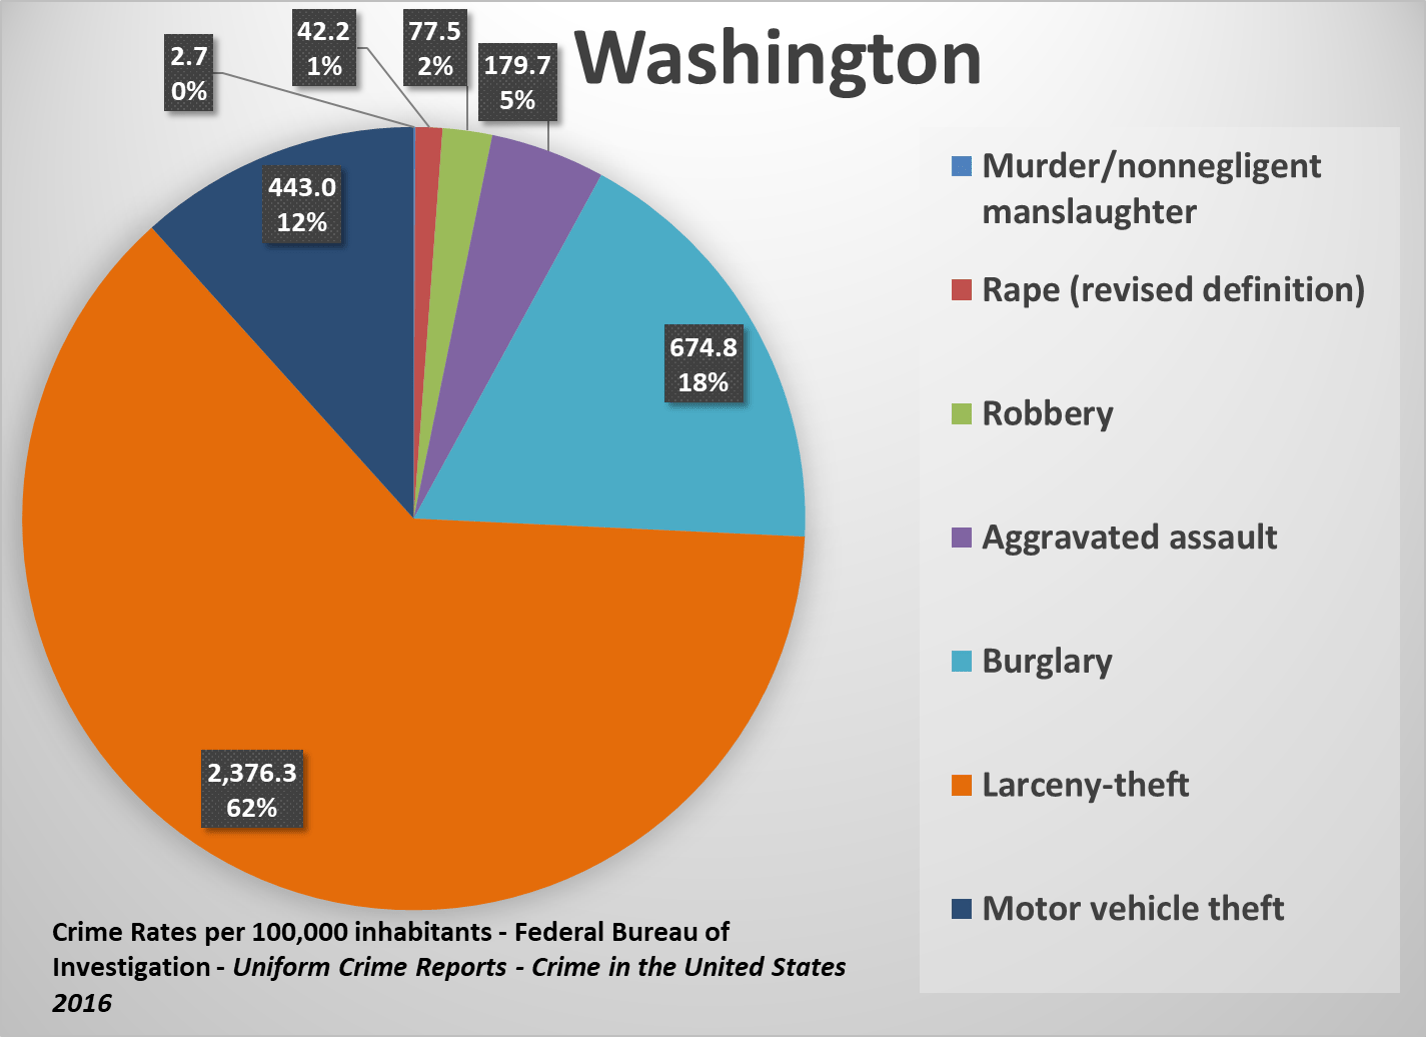
The State of Washington reported 302.2 violent crimes and 3,494.1 property crimes per 100,000 inhabitants for 2016. Washington’s violent crime rate is 18.4 percent lower than the national median, and the property crime rate is 35.3 percent higher. Washington has a similar proportional makeup of crimes by type to the national median.
West Virginia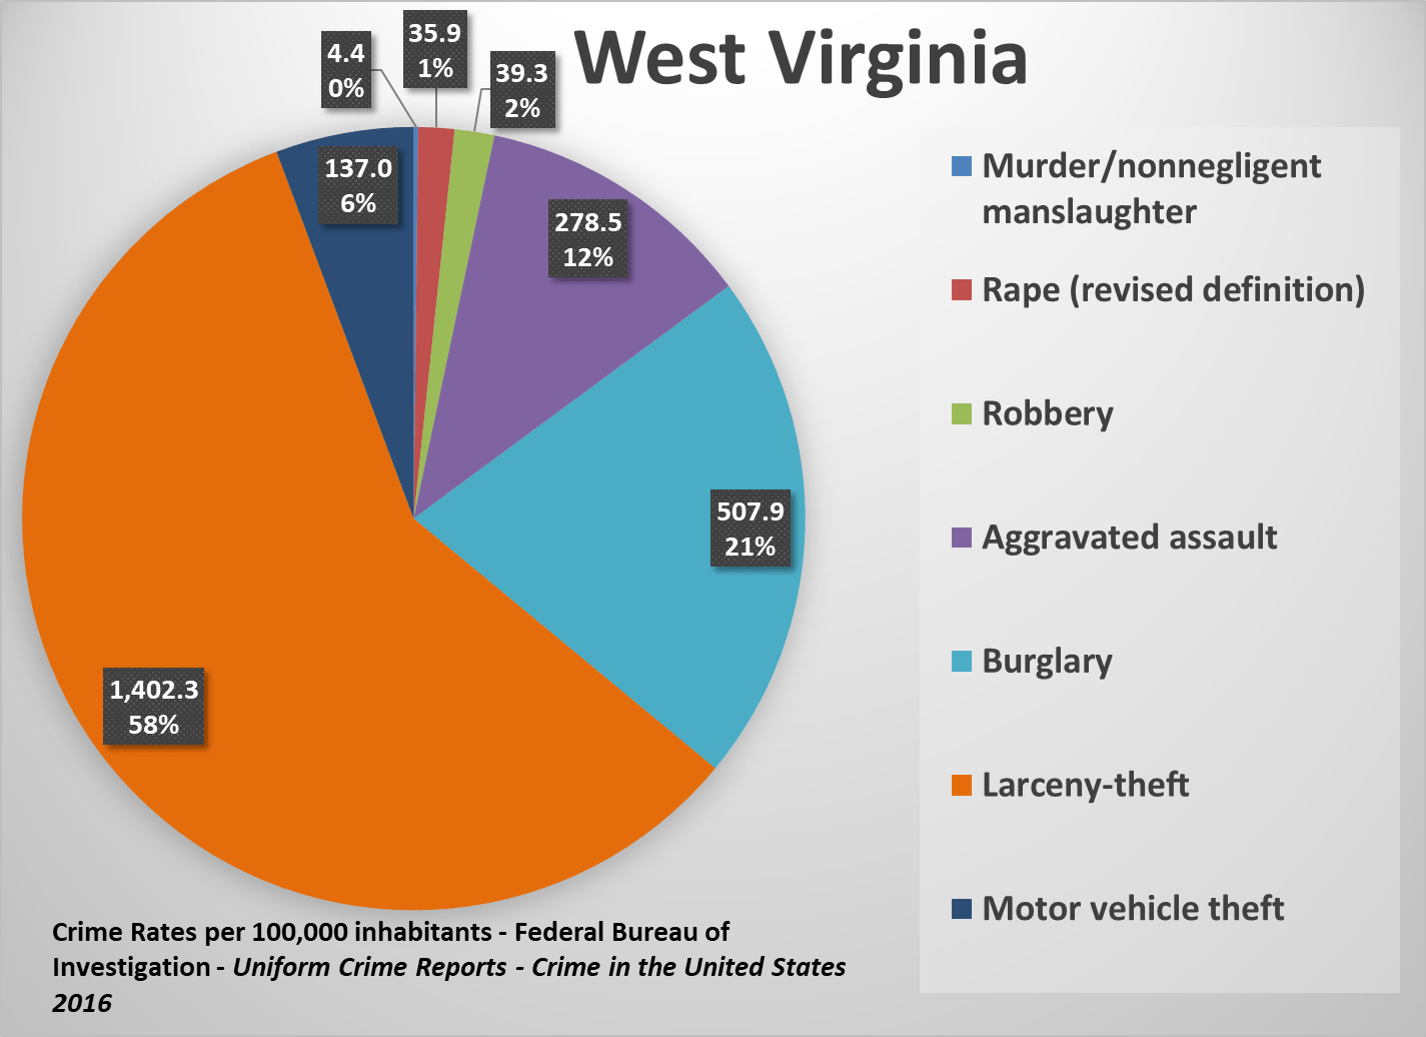
The State of West Virginia reported 358.1 violent crimes and 2,047.2 property crimes per 100,000 inhabitants for 2016. West Virginia’s violent crime rate is 3.3 percent lower than the national median, and the property crime rate is 20.7 percent lower. Larceny-theft is a smaller proportion of overall crime in West Virginia (58 percent) than nationally (63 percent), while burglary (21 percent) is a larger proportion than the national median (16 percent).
Wisconsin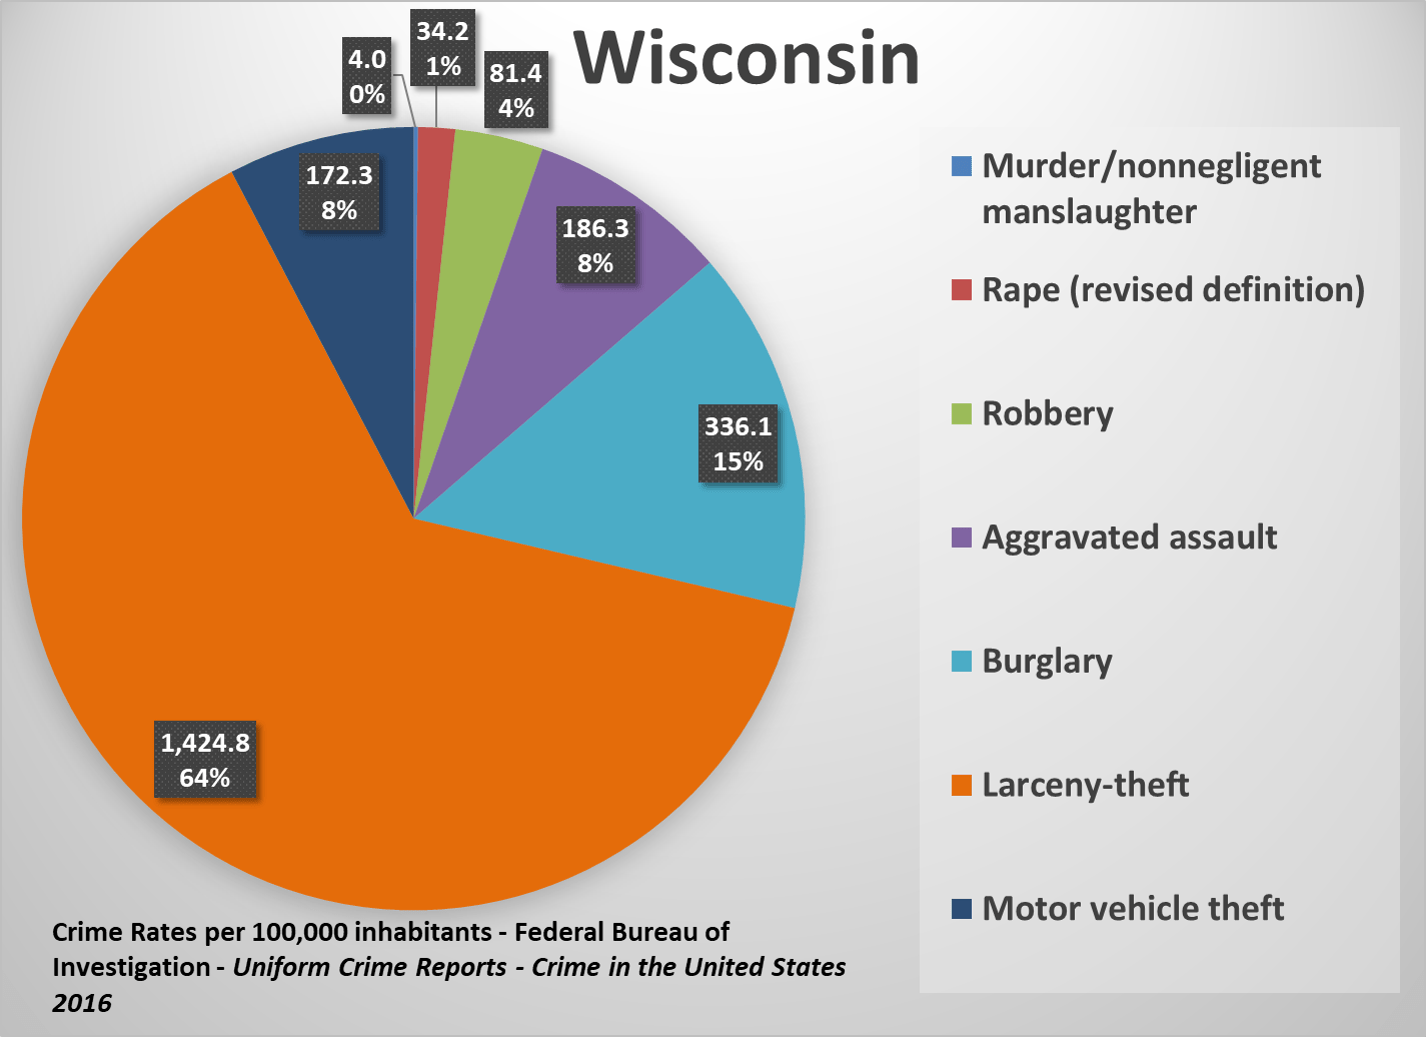
The State of Wisconsin reported 305.9 violent crimes and 1,933.3 property crimes per 100,000 inhabitants for 2016. Wisconsin’s violent crime rate is 17.4 percent lower than the national median, and the property crime rate is 25.1 percent lower. Wisconsin has a similar proportional makeup of crimes by type to the national median.
Wyoming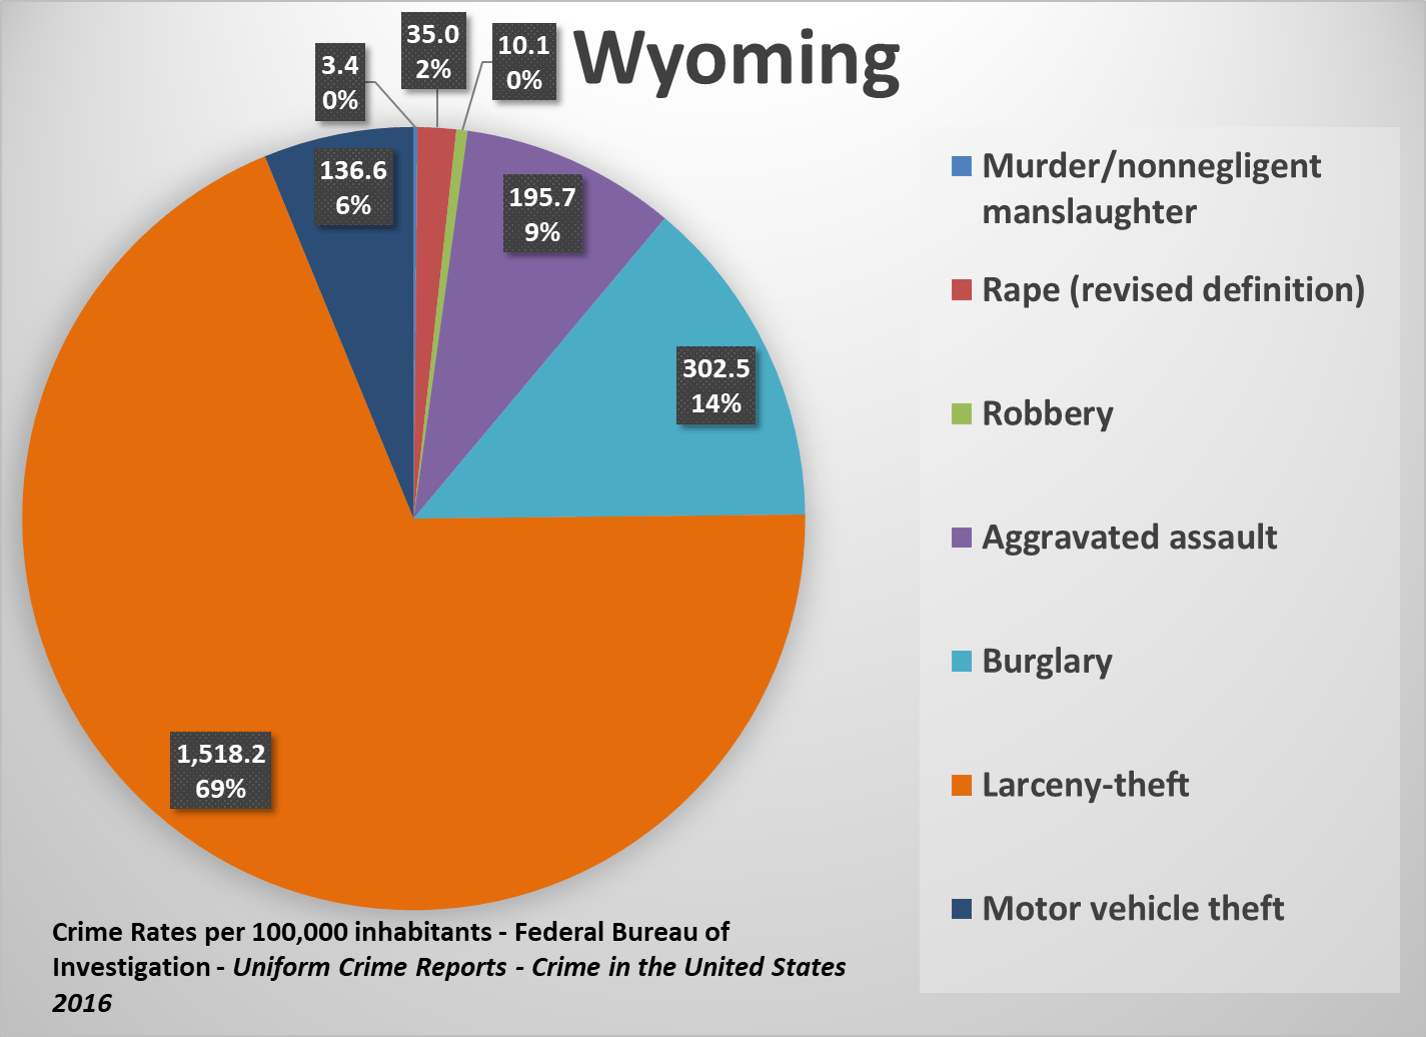
The State of Wyoming reported 244.2 violent crimes and 1,957.3 property crimes per 100,000 inhabitants for 2016. Wyoming’s violent crime rate is 34.1 percent lower than the national median, and the property crime rate is 24.2 percent lower. Larceny-theft is a larger proportion of overall crime in Wyoming (69 percent) than the national median (63 percent).
UCR Offense Definitions
The Uniform Crime Reporting system utilizes the traditional Summary Reporting System (SRS) to collect crime information. Within the SRS classification are eight crimes, chosen because they are serious crimes that occur regularly in all parts of the country, and are likely to be reported. The crimes and their definitions, per the FBI, are:
Criminal homicide—a.) Murder and non-negligent manslaughter: the willful (non-negligent) killing of one human being by another. Deaths caused by negligence, attempts to kill, assaults to kill, suicides, and accidental deaths are excluded. The program classifies justifiable homicides separately and limits the definition to: (1) the killing of a felon by a law enforcement officer in the line of duty; or (2) the killing of a felon, during the commission of a felony, by a private citizen. b.) Manslaughter by negligence: the killing of another person through gross negligence. Deaths of persons due to their own negligence, accidental deaths not resulting from gross negligence, and traffic fatalities are not included in the category Manslaughter by Negligence.
Forcible Rape/Legacy Rape—The carnal knowledge of a female forcibly and against her will. Rapes by force and attempts or assaults to rape, regardless of the age of the victim, are included. Statutory offenses (no force used—victim under age of consent) are excluded.
Revised Rape— penetration, no matter how slight, of the vagina or anus with any body part or object, or oral penetration by a sex organ of another person, without the consent of the victim. Attempts or assaults to commit rape are also included; however, statutory rape and incest are excluded. In December 2011, the UCR program changed its definition of SRS rape to this revised definition. This change can be seen in the UCR data starting in 2013. Any data reported under the older definition of rape will be called “legacy rape”.
*Starting in 2013, rape data may be reported under either the historical definition, known as “legacy rape” or the updated definition, referred to as “revised”.
Robbery—The taking or attempting to take anything of value from the care, custody, or control of a person or persons by force or threat of force or violence and/or by putting the victim in fear.
Aggravated assault—An unlawful attack by one person upon another for the purpose of inflicting severe or aggravated bodily injury. This type of assault usually is accompanied by the use of a weapon or by means likely to produce death or great bodily harm. Simple assaults are excluded.
Burglary (breaking or entering)—The unlawful entry of a structure to commit a felony or a theft. Attempted forcible entry is included.
Larceny-theft (except motor vehicle theft)—The unlawful taking, carrying, leading, or riding away of property from the possession or constructive possession of another. Examples are thefts of bicycles, motor vehicle parts and accessories, shoplifting, pocketpicking, or the stealing of any property or article that is not taken by force and violence or by fraud. Attempted larcenies are included. Embezzlement, confidence games, forgery, check fraud, etc., are excluded.
Motor vehicle theft—The theft or attempted theft of a motor vehicle. A motor vehicle is self-propelled and runs on land surface and not on rails. Motorboats, construction equipment, airplanes, and farming equipment are specifically excluded from this category.
Arson—Any willful or malicious burning or attempt to burn, with or without intent to defraud, a dwelling house, public building, motor vehicle or aircraft, personal property of another, etc. Arson statistics are not included in this table-building tool.
Usefulness of UCR Data
UCR crime statistics are used by many stakeholders in various ways. Policymakers, researchers, law enforcement, agencies, chambers of commerce, media, and the public all have reasons to look into crime levels and types. Sometimes their reasons overlap, and sometimes they do not. The FBI cautions against using crime data to rank jurisdictions such as states, counties, and cities, or specific law-enforcement agencies, against each other. Below is a list, provided by the FBI, of just some of the factors that reflect a community, and may influence the levels and types of crimes.
- Population density and degree of urbanization.
- Variations in composition of the population, particularly youth concentration.
- Stability of the population with respect to residents; mobility, commuting patterns, and
transient factors. - Economic conditions, including median income, poverty level, and job availability.
- Modes of transportation and highway systems.
- Cultural factors and educational, recreational, and religious characteristics.
- Family conditions with respect to divorce and family cohesiveness.
- Climate.
- Effective strength of law enforcement agencies.
- Administrative and investigative emphases on law enforcement.
- Policies of other components of the criminal justice system (i.e., prosecutorial, judicial,
correctional, and probational). - Citizens’ attitudes toward crime.
- Crime reporting practices of the citizenry.
While all of these factors should also be accounted for in researching states, counties, and cities, crime data is useful information. Use this report, as well as other reports made available by MuniNet Guide, to gain a deeper understanding of crime and public safety in your community.
by Jeffrey L Garceau