Accounting Approach Shows Aging Infrastructure Kicks Additional Costs to the Future
Validating the Aging Infrastructure Problem from the Engineer’s Point of View
There are few public-minded cities and governmental officials that are unaware of America’s recent habit of postponing infrastructure repair and replacement. The best known periodic documentation of the problem is usually associated with The American Society of Civil Engineers (ASCE), which produces a report card every four years evaluating the condition of public infrastructure from an engineering perspective. An overall grade point average is assigned, as well as grades for specific categories, e.g. highways, bridges and utilities.
Governmental accounting and financial analysis reinforce engineering perspective that things are bad, but also point to negative momentum
In its last report card, done in 2017, they gave an overall grade point average for infrastructure at the D+ level, on an A+ to F scale. The ASCE final grade has remained in the D to D+ bracket every report card since 1998. Categorical grades broke down as follows:
Reinforcing the Issuing from the Accountant’s Ledger
Merritt Research Services LLC, an independent municipal bond credit data and research company, takes a different perspective on evaluating infrastructure condition. It looks at governmental audits every year and uses a conventional financial measure to track infrastructure age of various governmental sectors, by tracking all governmental type net fixed assets and depreciation expenses. Using this formula, Merritt generates the median age of infrastructure. The trend is telling, and provides further reinforcement that capital outlay spending, the funding designated by governments for infrastructure acquisition and upkeep, is not sufficient to cover the annual depletion of the estimated useful life of a public asset, such as roads, bridges, street lights, or any other public infrastructure not covered by the funding from a separate public enterprise.
Focus on Cities
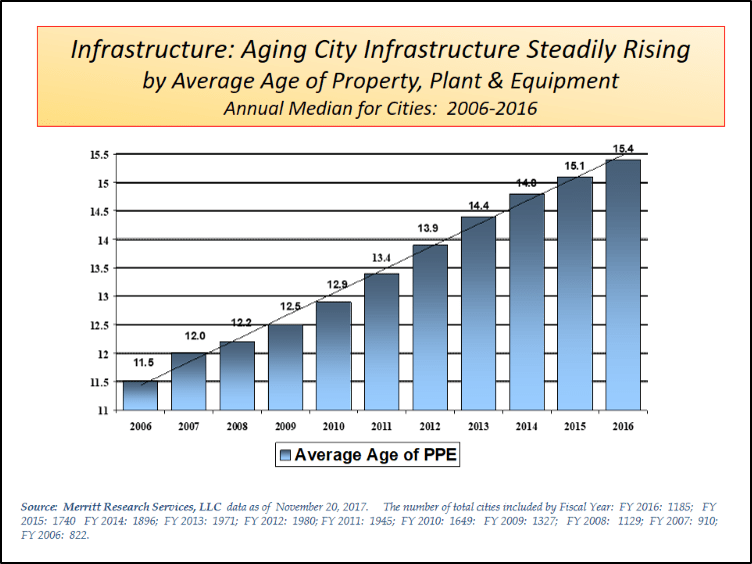
In the case of cities, Merritt’s numbers continue to show a steadily climbing infrastructure age, often referred to by accountants as Property, Plant and Equipment. The graph above illustrates increases in the average age of
Few trend lines in any research field attest to such a consistent, unforgiving trend.
infrastructure for ten consecutive years. Few trend lines in any research field attest to such a consistent, unforgiving trend. For fiscal year 2016, the average age of city infrastructure indicates a median of 15.4 years, up from 15.1 in 2015 and well ahead of the median in 2006 of 11.5 in 2006. These numbers reflect the median age across all types of infrastructure. It is important for individual cities and other governments to look at the types of infrastructure involved. For example, computers can be considered a capital asset and may, along with other structures and assets, including vehicles and, in some cases, sidewalks, only have useful lives of around 5-10 years. Computer stock and vehicles aged more than 10 years are likely past their useful life and are in desperate need of upgrade or repair. Conversely, many bridges may have useful lives of 50 years or more, and so 20 year-old bridges are common and should be of no concern.
While variances can occur from city to city based on their assessment levels, including the estimated useful life of the infrastructure, but also their allocation of assets in the mix, trends within an individual city remain comparable year over year. That means that the group trend line is significant and relevant, as it encompasses all infrastructure types and cities. Clearly, when it comes to infrastructure, America’s cities are going in the wrong direction.
Richard A Ciccarone