MuniNet Guide’s 50-State Employment Outlook Takes a Broader View of the State of State Employment Trends
by Jeffrey L Garceau
There have long been debates over whether the unemployment rate is the best metric for measuring the employment health of the nation, the states, or local and regional economies. After all, the number that is most commonly reported, the U-3 unemployment rate measured by the U.S. Bureau of Labor Statistics, does not reflect people who have fallen out of the labor force, the labor force being people who are either actively working, or have actively looked for work within the past four weeks. People who are not at least actively looking for work are not considered ‘unemployed’ in this measurement.
People may not be in the labor force for all kinds of reasons. Some of them may have just given up on finding a job, because their employment prospects are so poor. Some may feel compelled to seek more education for the same reason. Some may willingly be seeking more education to advance or change their career. Some may be caretakers. Good and bad reasons may be simultaneously influencing the same individual.
All of this means that deciding whether the U-3 unemployment rate is the best figure to measure or not is somewhat subjective. Certainly, it has useful information to provide us. If nothing else, it’s widespread reporting over many decades provides context of current conditions relative to the past. However, going beyond unemployment rate gives us a broader and more nuanced view of the employment situation in a state or local economy.
MuniNet Guide has devised a scorecard (State Employment Profile Scorecard) for all 50 states plus the District of Columbia. The scorecard measures three employment metrics: civilian labor force, labor force participation rate, and the unemployment rate (U-3).
MuniNet Guide’s State Employment Profile Scorecard produces two scores for each state and D.C. The Trend Score reflects the year-over-year percentage change in the total labor force, and the year-over-year change in the labor force participation and unemployment rates. It is a look at public data metrics of state employment trends. The Static Score reflects the most current monthly labor force participation and unemployment rates. The static total labor force number is left out of the Static Score, as it is largely a simple reflection of the size of a state, and is not a reflection of how a state’s job and employment market is performing. Each state and D.C. is ranked 1-51 for each metric, and the rank is equivalent to the number of points assigned to that state. For each Score, the points are totaled, and a lower overall score indicates a better overall performance in these metrics.
A Look at Top Performers
A brief look at the top three performing states in each metric shows the varying ways in which to look at state employment environments.
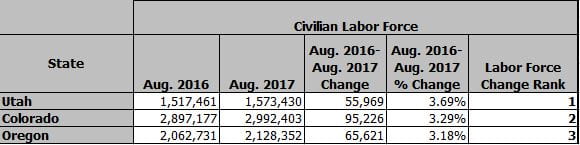
Civilian Labor Force Growth
Three western states all had the highest growth in labor force. Utah adding 55,969 people to their labor force from August 2016-August 2017, a 3.69% increase, followed by Colorado and Oregon.
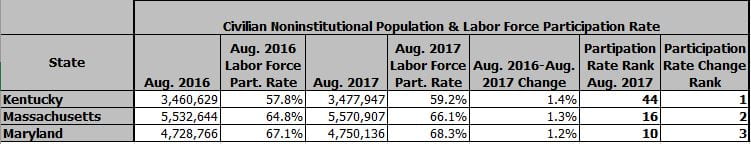
Labor Force Participation Rate Change
When looking at changes in the labor force participation rate, Kentucky led all states by improving its participation rate by 1.4%, from 57.8% in August 2016 to 59.2%. Massachusetts and Maryland also made strong progress in their labor force participation rate. The table below shows how one needs to look at both the year-over-year state employment trends as well as the static current number to place the overall employment profile in the proper context. While Kentucky had the best 12-month momentum in labor force participation, all that progress still only brings its participation rate to 59.2%, or 44th out of 51 jurisdictions. By comparison, Maryland improved an already-strong rate of 67.1% to 68.3%, placing Maryland 10th out of all states plus D.C.
Unemployment Rate Change
Alabama had the greatest reduction of its unemployment rate over the past 12 months, with a decrease of 1.7%, from 5.9% to 4.2% as of August 2017. Tennessee and Wyoming round out the top three states. Again, an example of the trends vs. the static rate is notable. Alabama, despite an excellent unemployment rate reduction, still remains in the lower half of states, ranked 30th with a rate of 4.2% as of this August. Tennessee’s reduction of 1.5% from 4.8% to 3.3% moves it into the top ten.

There are varying degrees of agreement on just what these metrics tell us. What are we to make of states being strong in one metric and weak in another? A low unemployment rate may not be as strong an indicator of a healthy employment environment in a state with a low labor force participation rate as a state with a higher rate.
What the Measurements Mean
The civilian labor force is the total number of civilian noninstitutional population residing in the 50 states and the District of Columbia who are employed or unemployed but actively looking for work (‘actively’ being within the past four-weeks). The civilian noninstitutional population is the total number of persons in a state 16 years of age and older who do not live in institutions (for example, correctional facilities, long-term care hospitals, and nursing homes) and who are not on active duty in the Armed Forces. A growing labor force is generally a positive trend; it can indicate an overall growing population, and a growing economic base. If the population and labor force are growing because of incoming migration, that is a sign that a nation, state, or locality is desirable to outside populations. An organically growing population indicates a strong percentage of the population being of young-adult, family-raising years. Either reason for growth indicates a positive reflection of the short and long-term economic prospects of a state.
The labor force participation rate represents the percentage of the civilian noninstitutional population in the labor force, or the fraction of the employable population that is working/looking for work. Typically, a lower and/or declining labor force participation rate is viewed as a negative. A low participation rate indicates that those who should presumably be working are not. If the participation rate is shrinking due to the fact that the population is aging, and there are a growing number of elderly, retired persons, as we know to be the case in the United States, it could indicate a trend that will put strain on state economies and state government budgets. Fewer workers paying in taxes, and more elderly people eligible for government programs and requiring services.
However, some argue that, while an aging population is certainly part of the equation, if many working-age people are out of the workforce getting educated, this could be a positive sign of future workforce talent, and future personal income and tax revenues. Finally, while less likely to be true at the national level, some particularly affluent localities and even states could have lower labor force participation rates, because more families are able to sustain themselves off a single income, allowing other household adults to be caretakers, students, etc. Despite all this, it is generally recognized that a high and/or increasing labor force participation rate is a positive indicator.
The unemployment rate represents the percentage of the labor force that is not employed, not a percentage of the total population. These are people who have been established as not willingly out of the workforce, and have not given up trying to seek employment. Unemployed persons are definitively people who are not working and are actively looking for work. A low and/or declining unemployment rate is desirable.
What the Scorecard Can (and Can’t) Tell Us
The Trend Score and Static Score both mean different things. The Static Score represents where a state is, and the Trend Score the direction it is heading. The state employment Trend Score is more comparable across jurisdictions, because the momentum in either direction represents very similar impacts in all states. Comparatively, the static scores may not be as reflective of a state’s overall employment environment. For example, California is ranked 35th in labor force participation rank, with a rate of 61.9%, as well as 44th in unemployment rate rank, with a rate of 5.1%. These numbers give California a Static Score of 79 points, tied with Alabama for 43rd. Few would likely make the argument that California is only 43rd or 44th among all states for overall employment health. As a point of comparison, Kansas ranks 12th in total Static Score, being 19th among states with an unemployment rate of 3.9%, and 12th in labor force participation rate, with a rate of 66.9%. It is also unlikely that many would argue Kansas provides more dynamic opportunity or security for workers than California.
What is to be made of this? We must consider that California has a labor force and overall population more than ten times that of Kansas. With greater size generally comes greater diversity; diversity of ethnicity, income, family size, population age, etc. That diversity and size makes the state-wide static figures are less instructive of any one particular locality within California than that for Kansas. Smaller, more homogeneous state’s static numbers more closely represent the overall conditions for that state.
The Trend Score better represents what it purports to show. A reduction in unemployment rate, and increase in labor force participation, and an increase in the overall labor force population will represent positive state employment trends, regardless of population size. However, there are some caveats. In general, the largest population states hold the largest population cities. As the nation continues to become more urbanized, it makes sense that those who may have need of work tend to flock to cities for the opportunities they represent. A state like California, with 95% of its total population living in urban areas, may be absorbing some of the people looking for work in states with less urbanized populations, propping up the more unemployment rate of a more urbanized state, and lowering that of a less urbanized state, despite the fact that people are seeking out the more urbanized state for its job opportunities. A deeper investigation of specific circumstances would need to occur. Still, despite the nuances of specific comparisons, the takeaways of the overall Trend Score is valuable to researchers and job-seekers.
MuniNet is going to list the Trend and State scores of each state on that state’s Demographics Page. Furthermore, employment, unemployment, and labor force statistics from the Bureau of Labor Statistics can be found at our Employment Database. The information provided on these pages can be useful to researchers of state and local governments, economics, and demographics, as well as job seekers. Job seekers can use this information to inform their job search, which can start at MuniNet Guide’s Job Listings Page.
*All data in this piece is derived from the U.S Bureau of Labor Statistics, unless otherwise specifically noted. The unemployment and labor force numbers are derived from the latest August 2017 figures, released last week. Civilian noninstitutional population and labor force participation rate figures come from this report from BLS, using data from the U.S. Census Bureau.