Study Finds Immigration Short-Term Net Cost; Long-Term Impacts
by Jeffrey L Garceau
Immigration is always in the news, and immigration policy is never settled. While there are many controversial facets of immigration policy in the United States, one way policy makers can make decisions is using cost-benefit analysis, to try to measure the pros and cons of immigration in a quantifiable way. That is exactly what Kim Rueben and Sarah Gault of the Urban Institute have set out to do in their report State and Local Fiscal Effects of Immigration. Specifically, the researchers built a cost-benefit analysis, which compares the total surplus or cost of immigrants by state, compared to native-born citizens.
The study utilized two data-sets from the U.S. Census Bureau, one to obtain information on demographic characteristics of immigrant and native populations, and the other for information on state and local government finances, including program expenditures and tax revenues. Focus was restricted to the years 2011-2013, based on data availability and in part on the desire to take a ‘snapshot’ look at the effects of immigration at a period in time, rather than over the course of many years or decades. The study is a follow up to work the researchers did as contributors to the The Economic and Fiscal Consequences of Immigration, a 2016 panel report commissioned by the National Academies of Sciences, Engineering, and Medicine, which took a more holistic look at immigration effects, beyond the specific impacts to state and local government finances.
Where Immigrants Are
Source: Urban Institute, Rueben and Gault
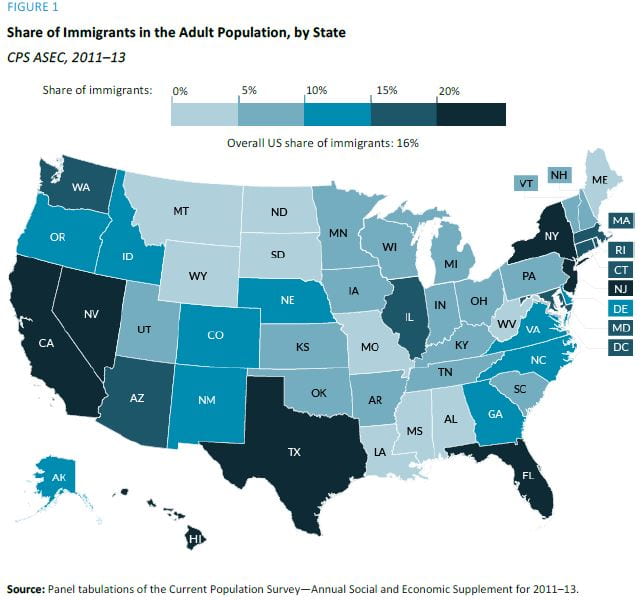
One of the first things that needs to be determined is to find out where immigrants reside in this nation, and how many there are. As Figure 1 (click to expand) shows at right, the results are unsurprising, the heaviest immigrant states are the well-known immigrant hub of California (35% of the adult population are immigrants), followed by New Jersey (28%), New York (27%), Nevada (25%), Florida (23%), and Texas and Hawaii (21% each). The states with the lowest immigration percentage of the adult population are West Virginia (1%), followed by Mississippi, Montana, Wyoming, North Dakota, and Maine (3% each).
While the geographic distribution of the immigrant population in the U.S. is what most would expect, some may be surprised at the high percentages, particularly that over one in three Californians are immigrants. It is important to clarify that this study counts as immigrants anyone currently living in the United States who is not a native-born citizen, or a born citizen who was born abroad to U.S. citizens. All citizens living today who were born in another country, then immigrated to the U.S., as well as all current legal and illegal (as best as can be accounted) immigrants are considered part of the immigrant population.
How Costs and Benefits are Determined
Cost-benefit analysis involves taking real data, and making choices about how the costs and benefits, the revenues and expenditures, ought to be assigned. In the case of government revenues and services, revenues can be measured for different groups by looking at their demographic makeup and the tax structures of various jurisdictions. For example, Florida does not have a state income tax, but relies heavily on sales taxes. These consumption taxes act regressively, increasing the burden on lower income households and individuals, because certain amounts of spending on food, clothing, shelter, and other necessities are not optional; even the poorest families have to choose to spend on these items, and thus pay taxes through their purchase. Conversely, California has a progressive income tax, which means it collects a much higher proportion of its tax revenue from higher-income households and individuals. Immigrants in general have a lower median income than natives, and therefore contribute a higher portion of overall tax revenue in Florida than in California.
Expenditures vary widely among states as well. The largest overall expenditure of state and local governments is public education. Per-capita and per-pupil spending on education range greatly. For example, according to the study, New York State spent $20,156 per student during the 2013-2014 school year. Comparatively, California spent only $9,671. Additionally, the median immigrant household has more children per adult than native households. With both of these factors in mind, government education spending is greater for an immigrant family with more children than a native family with fewer children, regardless of other factors.
Public Goods
Education is one area that it is possible to get a decent approximation of costs, because each student requires a set amount of additional spending by state and local governments. However, there are some public goods and services upon which immigration has little-to-no impact. For example, while massive population increases may put additional strains on things like roads and public libraries in the long run, much of the expenditures in these areas are fixed costs. Spending on the local library system does not increase by a tangible amount with the addition of a single individual, but school system costs do increase by some tangible amount with the addition of each individual student. Furthermore, it may not be appropriate to assign expenditures like pension obligations to newly-arrived immigrants, as they have not received the benefits of those expenditures to nearly the same degree as people who have been living in a jurisdiction their entire lives. It should be stated that this same argument could be made about young people generally.
For these reasons, the researchers ran the numbers two different ways, by average cost and marginal cost. Average cost simplifies the analysis, by spreading out government expenditures equally among immigrants and natives. In this analysis, the only differences in individuals’ costs are due to demographic differences like income and number of children. Under marginal cost, decisions are made as to how to assign costs based on whether additional immigrant populations really increase the costs, or whether immigrants shared in the benefits derived. Again, if an immigrant family has two children and a native family has one, the immigrant family should be assigned a greater share of overall education costs. In this scenario, having an additional child does not warrant assigning greater costs to the immigrant family in areas like road maintenance or policing.
The Bottom Line
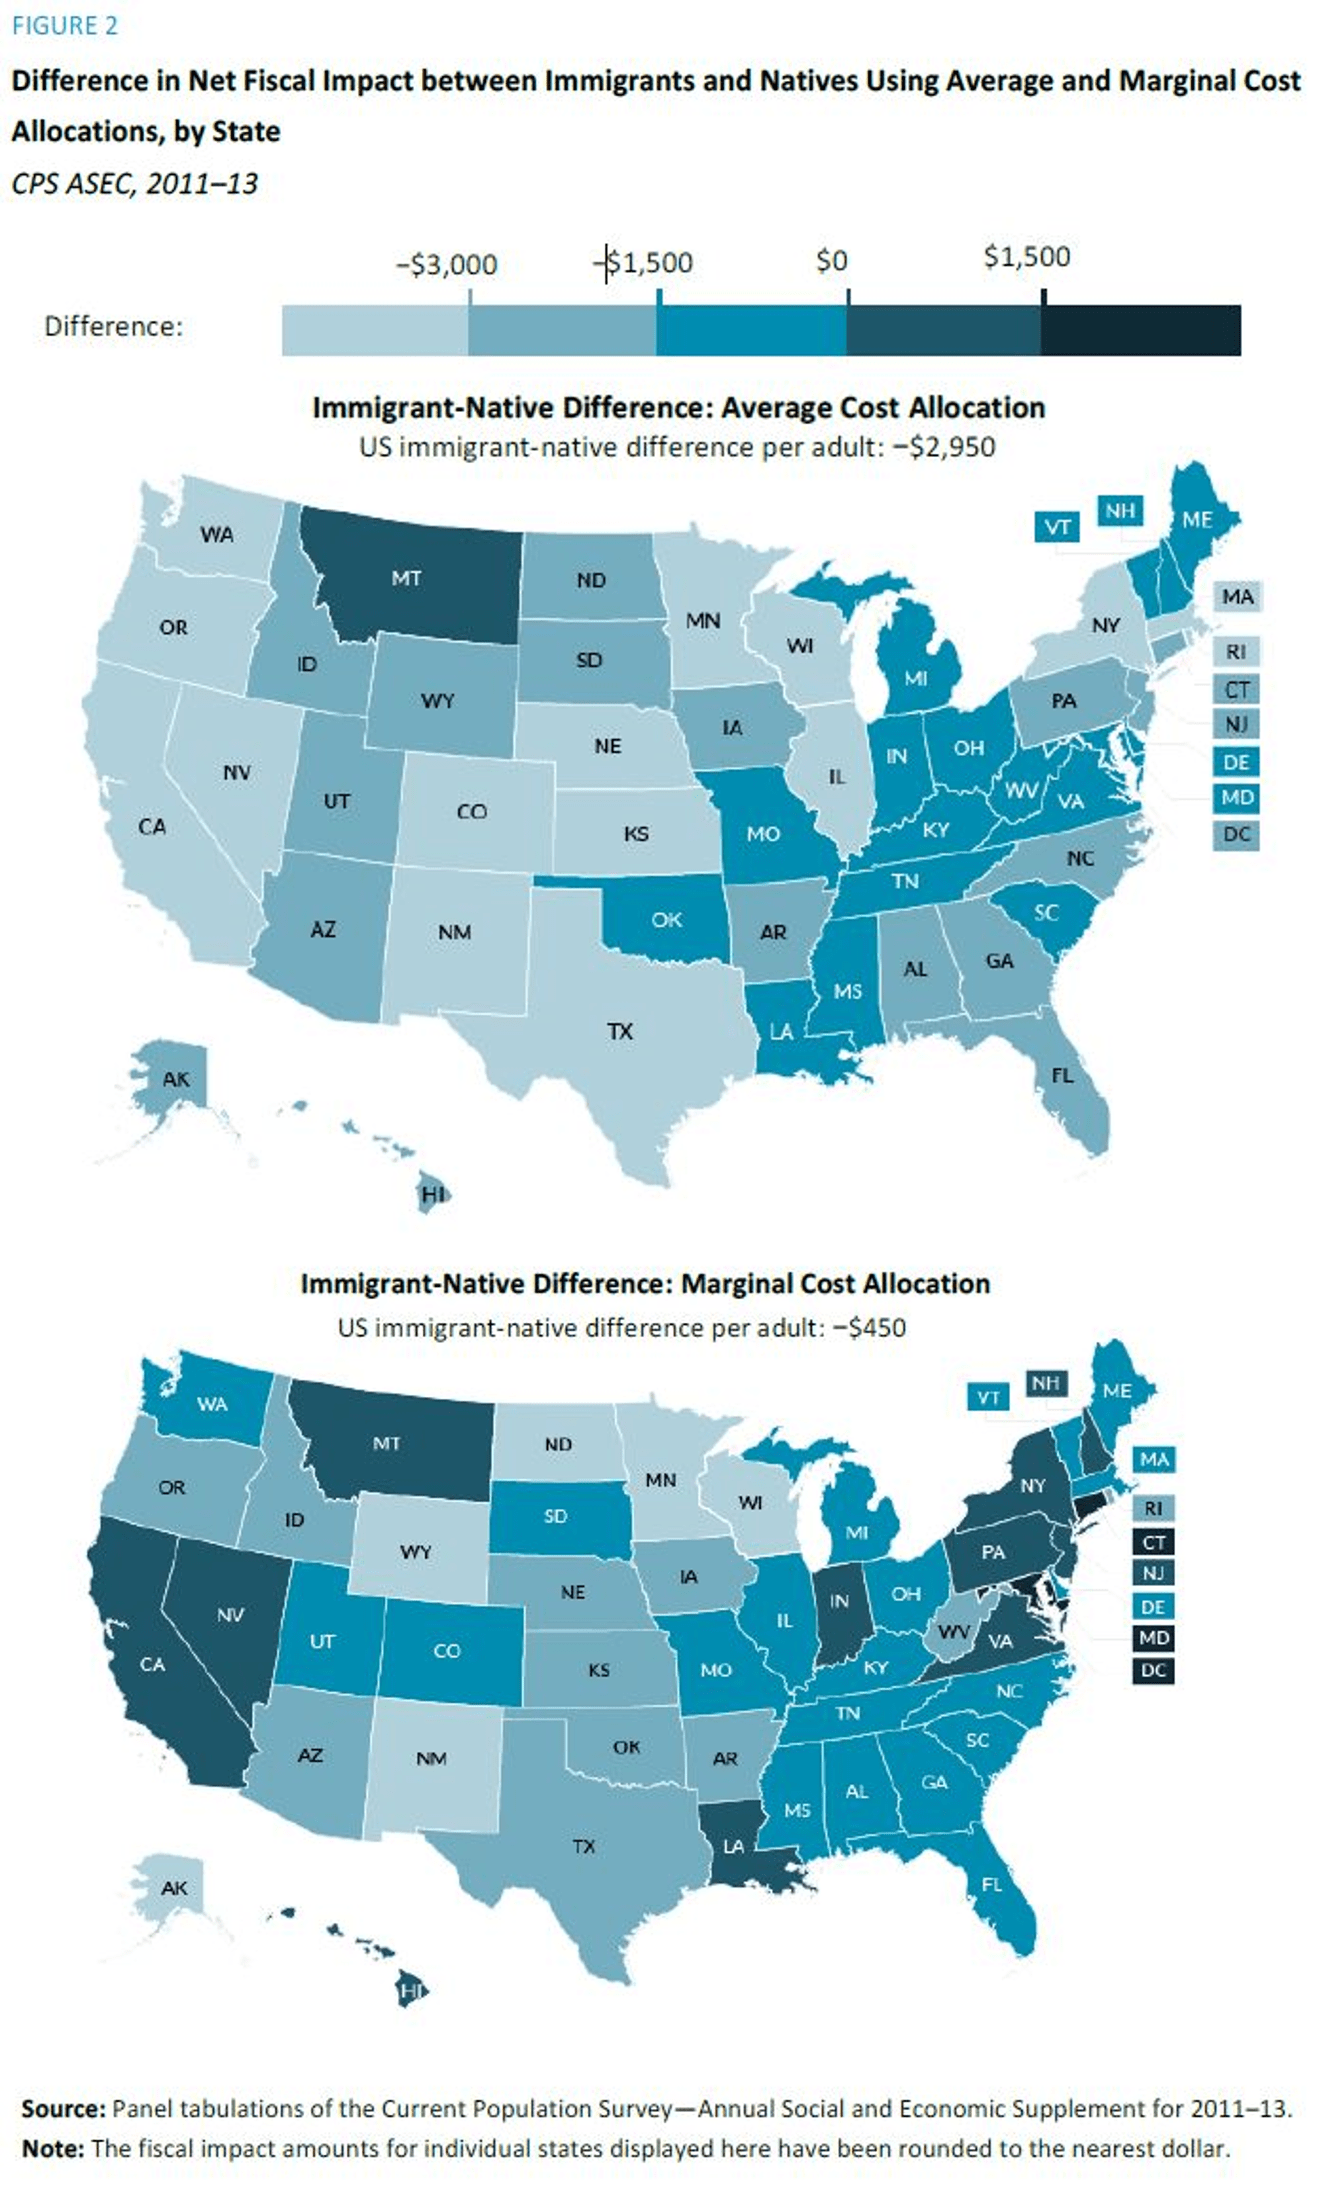 Figure 2 (click to expand) at right displays the results based off the two different types of analyses. For both maps, states shaded the two darkest colors are found to have immigrant populations contributing more (or costing less) to state and local government finances than native populations. States shaded the three lightest colors are found to have immigrant populations that contribute less (cost more) than native populations.
As Figure 2 shows that under both scenarios, the national average of immigrant populations cost state and local governments more per adult than native populations. The differences under each scenario are striking. Under the average cost scenario, the U.S. average adult immigrant costs state and local governments $2,950 more per year than a native adult, and only Montana has an immigrant population with lower relative costs. Under the marginal cost scenario, the average cost per adult drops to $450 more immigrants than natives. In this scenario, 13 states plus the District of Columbia have immigrant populations that generate more benefits (fewer costs) than native populations.
The Whole Story?
Any well-executed cost benefit analysis acknowledges the limitations of cost-benefit analysis. The researchers express the limitations of their study based on data availability, and that their decisions and assumptions are based in part on specifics that cannot be known. They in particular point out repeatedly that, due to data limitations, their analysis is more accurate for states with larger immigrant populations, both in real numbers and proportionally, than states with smaller immigrant populations. While the specific numbers for states with less immigrants are more questionable, the general trend is consistent across the states, so the conclusions drawn are still sound.
State treasurers and budget officers will be much more preoccupied with the annual net fiscal impacts of immigrant populations in a given year than over the course of decades. According to this study, immigrant populations cost state and local governments more than native populations in the short term, mostly due to increased education costs for the children of new immigrants. However, the researchers also noted that certain costs, especially education, are better categorized as investments, the benefits of which will be realized many years in the future. Investing in the education of a person who will be working and contributing taxes is largely a positive expenditure. They will increase their skills and income potential, and become more knowledgeable citizens. Examining cases over a lifetime may reveal that up front costs of new immigrants are high, but net benefits over a lifetime are positive.
Certainly immigration policy debates can include the overall lifetime costs and benefits of immigrants and their children, as well as a host of other quantitative and values-based arguments. Many long-term benefits were not included in this study, including positive effects of immigration on economic growth. A key benefit of immigrants is that their larger families mean they are making greater contributions to future workforce populations, a very important demographic component of future economic growth and generational renewal. This study also does not focus on the federal government, for which new immigrants are a net fiscal benefit. State and local governments bear the greatest expenditures on minors in the form of education, and the federal government bears the greatest responsibility for the elderly in the forms of Medicare, Medicaid, and Social Security. Fewer new immigrants are elderly relative to the native population, and so immigrants are paying into federal revenues at a greater rate than they are receiving benefits compared to native-born citizens.
Lastly, the study does not touch upon values-based and cultural pros and cons of immigrants and immigration policy. This is prudent, because such ideas, while being able to be seen as either positive or negative, are not suitable to measurement as quantifiable costs and benefits. It must also be remembered that the numbers in this report show states have some control over their own destiny in how they balance the costs and benefits of immigrants in comparison to natives, particularly through tax policy. While the evidence shows that state and local governments may have high costs related to new immigrants in the short term, this is but one of the many factors, including many long-term benefits, policymakers and the public should weigh when considering immigration policy.