Southeast and Southwest Both Experience Strong GDP Growth, Most States Improve Over Q1 2016.
The U.S. Bureau of Economic Analysis has released their Gross Domestic Product numbers for each state and region for the first quarter of 2017. Positive GDP growth occurred in 42 states plus the District of Columbia, and seasonally adjusted annualized growth in Q1 2017 was faster (1.2 percent) than in Q1 2016 (0.8 percent). These national numbers are slightly different from the numbers commonly reported for the U.S. in other reports, as they are a composite of activity within the states. Thus, they do not include overseas economic activity of the Federal government, which gets reported in the traditional national figures. However, the general growth trend is consistent.
Seven states had the five highest growth rates, with Texas taking the top spot for the second consecutive quarter, with 3.9 percent growth. Interestingly, high-growth states were dispersed. The seven states with the five highest growth rates, ranging from 2.1 percent to 3.9 percent growth, were spread among six of the eight distinct economic regions determined by the BEA. Texas and New Mexico are both part of the Southwest region, West Virginia is a part of the Southeast region, Maryland is in the Mideast, Wisconsin in the Great Lakes, and Idaho is part of the Rocky Mountain Region.
The five states with the lowest growth rates were much more homogeneous. With the exception of Hawaii in the Far West Region, with a negative GDP growth rate for the first quarter of -0.9 percent, all four other states in the ‘bottom five’ are part of the BEA’s Plains region. Nebraska had the worst growth rate in Q1 of all states, at -4.0 percent, with its neighbors South Dakota, Iowa, and Kansas all rounding out the bottom five. The map below from the Bureau of Economic Analysis shows the seasonally adjusted annual GDP rate change for Q1 2017 for all fifty states plus D.C.
Biggest Movers – State GDP % Change 4th Quarter 2016
TOP FIVE(Seven):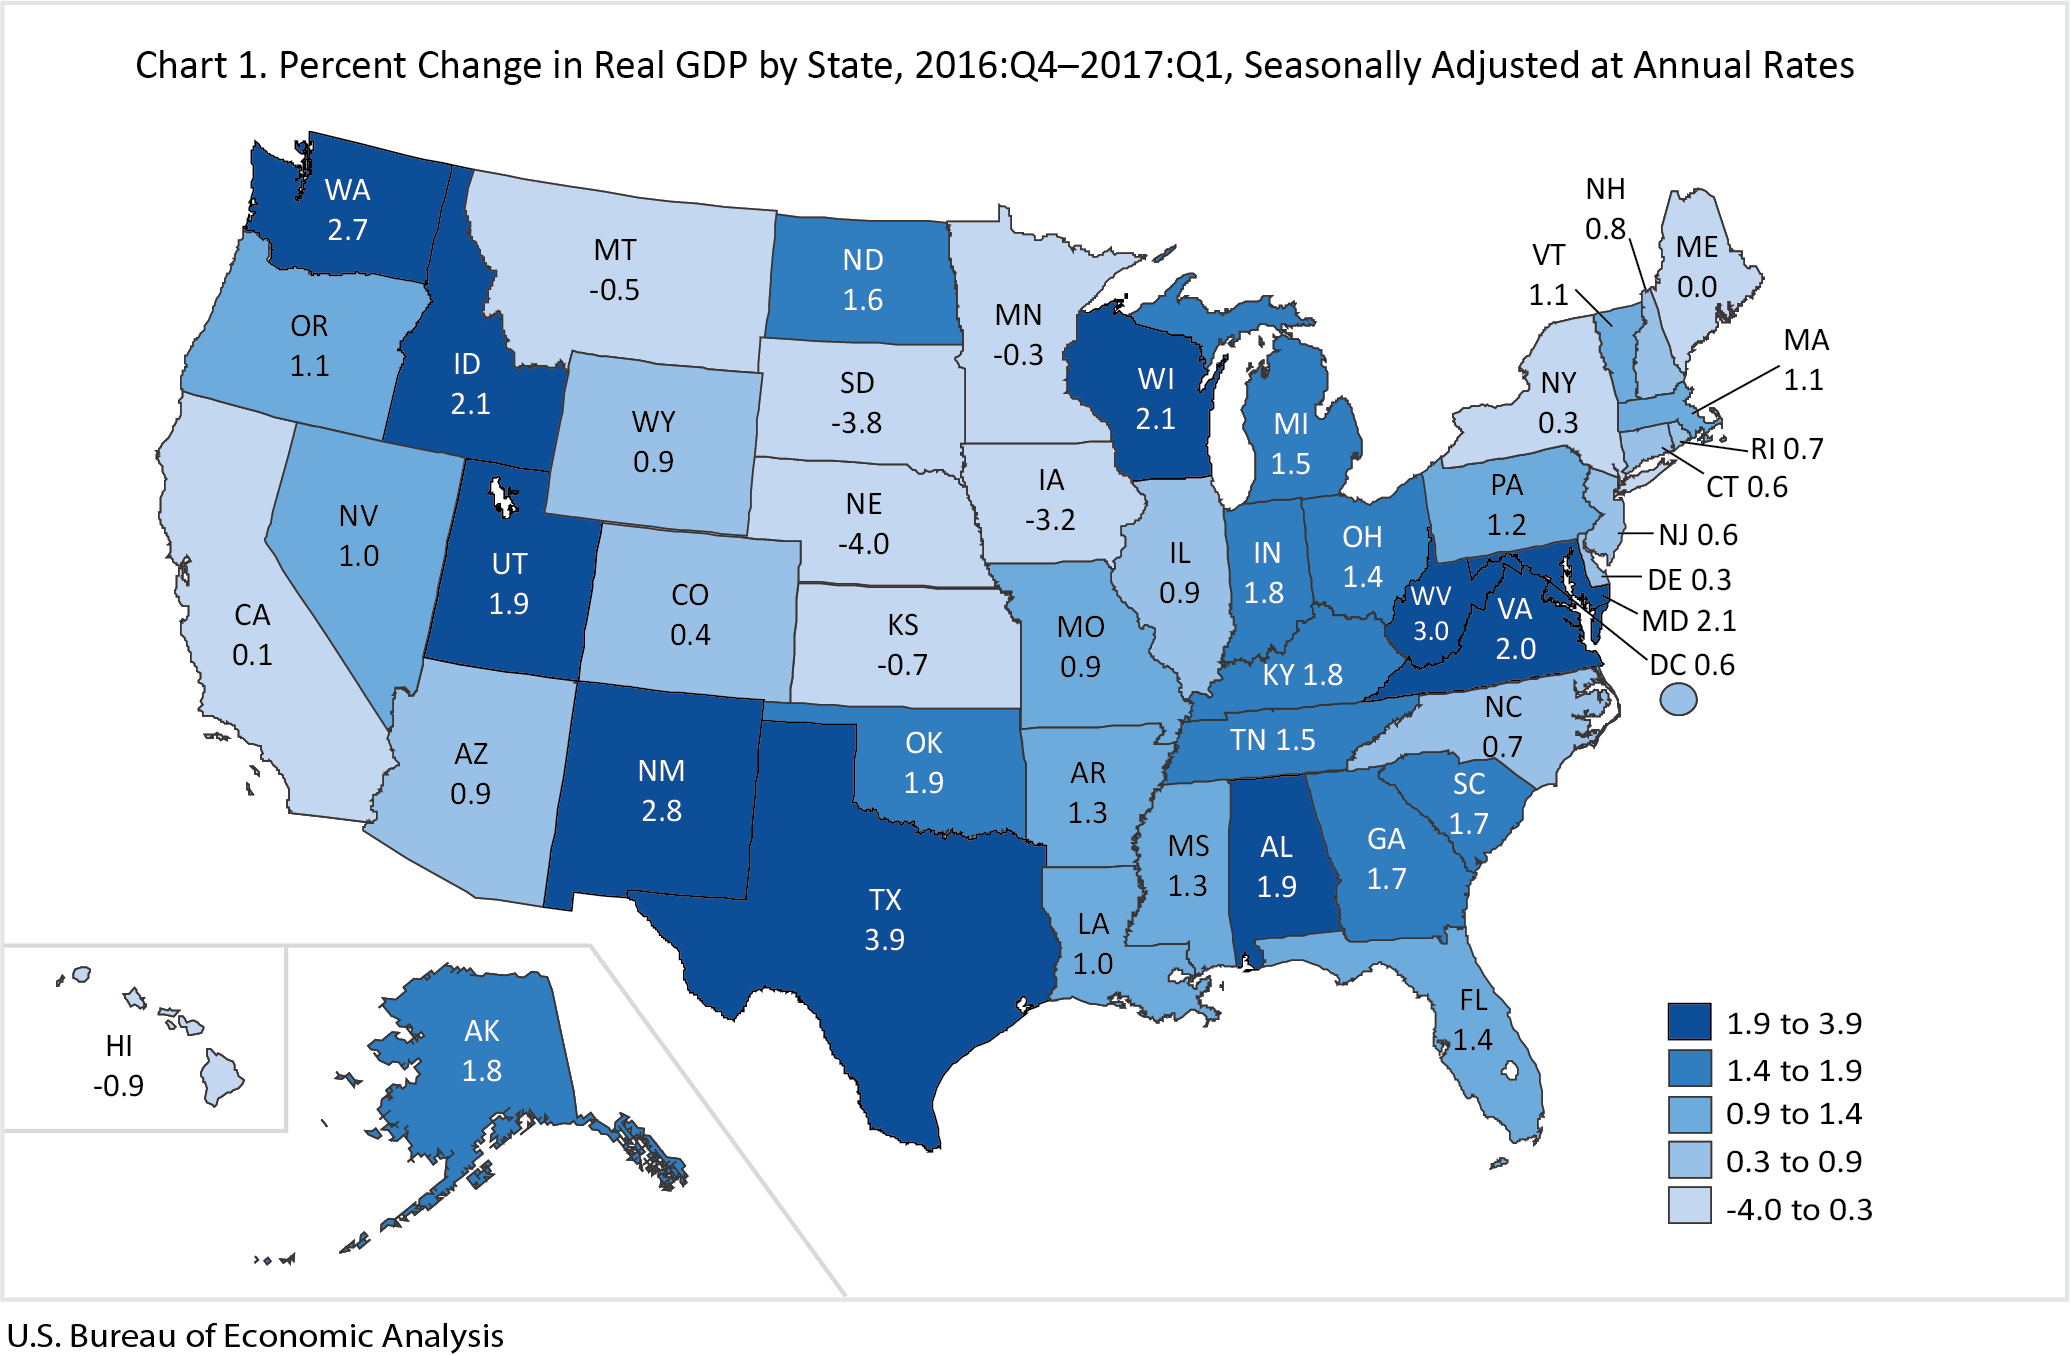
- Texas – 3.9%
- West Virginia – 3.0%
- New Mexico – 2.8%
- Washington – 2.7%
- Maryland, Wisconsin, and Idaho – 2.1%
BOTTOM FIVE:
- Nebraska – -4.0%
- South Dakota – -3.8%
- Iowa – -3.2%
- Hawaii – -0.9%
- Kansas – -0.7%
Looking at the year-over-year changes, 32 states had higher GDP growth in Q1 2017 than in Q1 2016, while 17 states and D.C. had lower GDP growth. Wyoming’s growth remained flat at 0.9 percent. The District of Columbia saw the greatest decline, growing at a seasonally adjusted, annualized rate of 9.0 percent in Q1 2016, declining 8.4 percent to a growth rate of 0.6 percent in Q1 2016. The state of Washington saw the worst year over year results of any state, declining from 10.1 percent growth in Q1 2016, to 2.7 percent in 2017. North Dakota had by far the strongest turnaround, with a negative growth rate of 12.9 percent in Q1 2016, increasing 14.5 percent to 1.6 percent positive growth in Q1 2017.
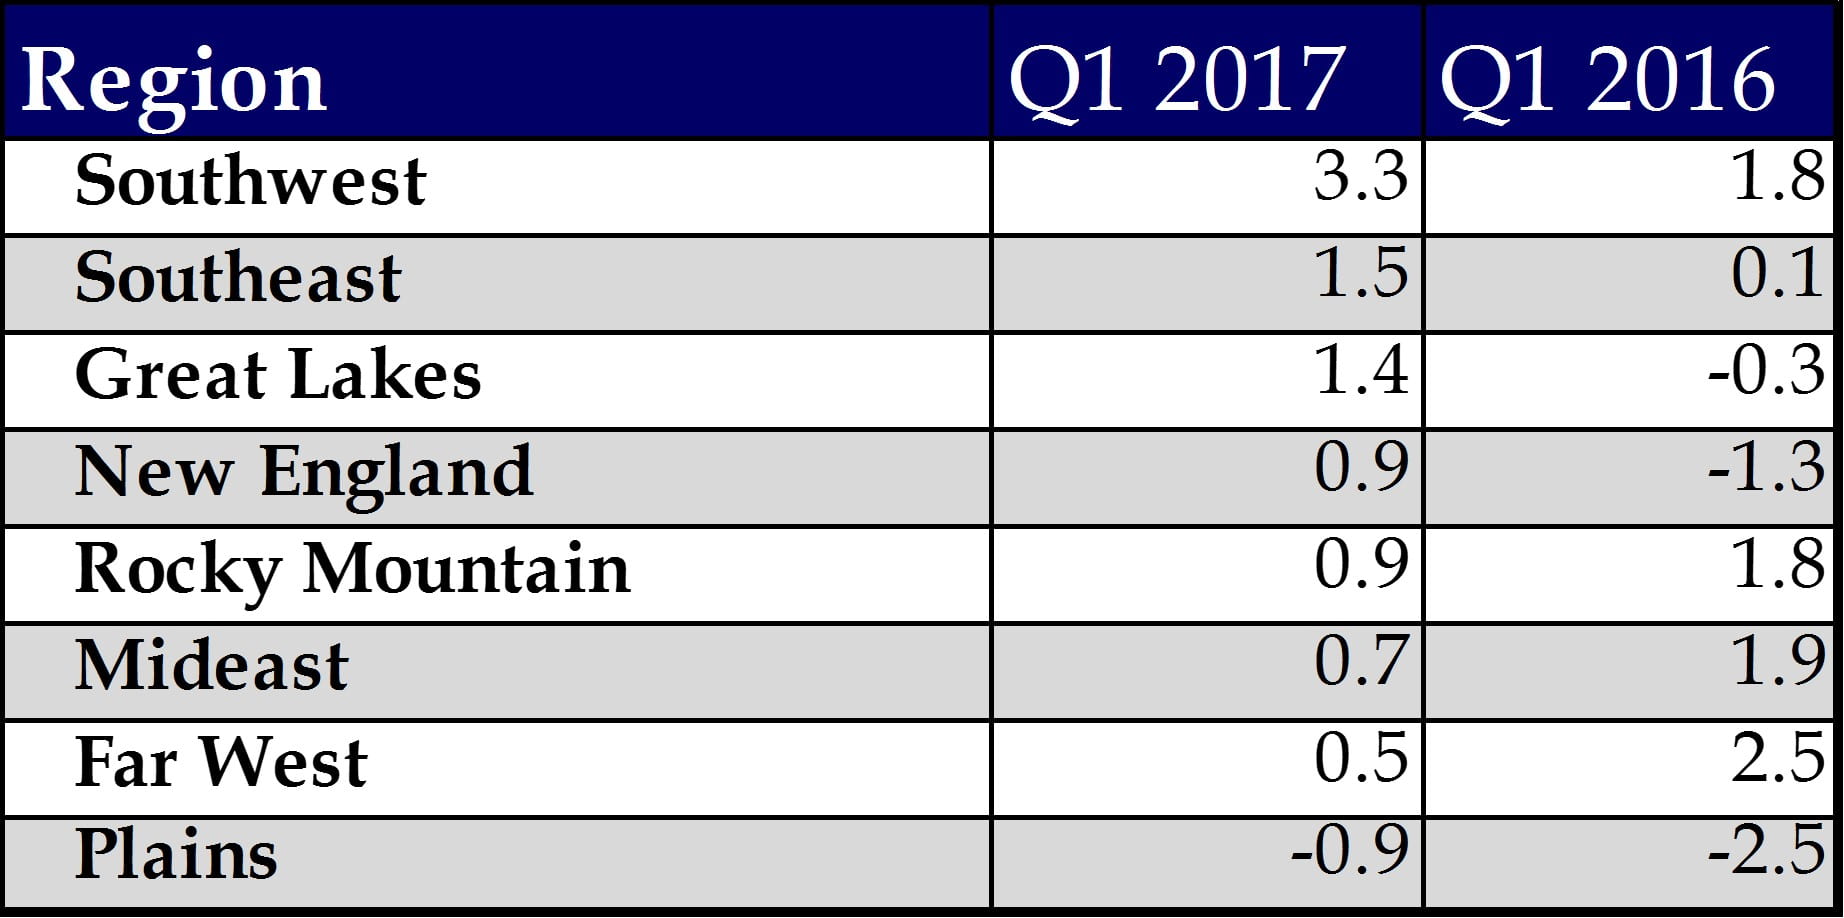
How Regions Rank
The BEA designed its regions as groupings of states based on the homogeneity of the states in terms of economic characteristics, such as the industrial composition of the labor force, and in terms of demographic, social, and cultural characteristics. While these regions were developed in the mid-1950s, and the makeup of the states has changed, the regions have been formed to reflect a particular economic character for each region, so their comparison is worth examining.
MuniNet ranked the eight regions categorized by the Bureau of Economic Analysis by GDP growth rate for Q1 2017, and compared to the growth rates in Q1 2016. What stands out is that, while the two southern regions were the top performers, New England and the Great Lakes regions saw both relatively high growth in Q1 2017, but also improved over their Q1 2016 figures. The Rocky Mountain and Far West regions, which have seen strong economic growth in recent years, declined year over year. The Plains region actually improved from Q1 2016, but still lags all other regions; these states rely heavily on the fossil fuel industry, and while crude oil has recovered somewhat from the devastating two-year decline from 2014-2016, it still is nowhere close to the levels seen in the boom years immediately following the Great Recession.
Taking a deeper look at the data shows much going on underneath the surface of the overall national figures. Our state and local economies influence he we perceive the country is doing, in as much as Gross Domestic Product is a proper measurement of economic performance. Access to the full set of data provided by the BEA can be found here.
by Jeffrey L Garceau