In Part I of ‘Overcoming Economic Downturns and Fiscal Distress’, James Spiotto Looks at the Gathering Storm in Illinois and Its Municipalities since 2000
In the Introduction to this series, James Spiotto stressed the need for deliberate, disciplined activity on the part of policymakers to prevent and, when necessary, overcome fiscal distress. Additionally, MuniNet looked at the history and trends of fiscal distress, and a broad overview of the historical and currently evolving causes of financial distress for state and local governments. In Part I, Spiotto analyzes the recent financial challenges that state and local governments have faced, in particular Illinois and its municipalities.
by James Spiotto
Illinois and Its Municipalities Have Faced Some Challenging Financial Developments Due to the Great Recession, 2010 Reduction in Income Tax Rates and Income, Increased Unfunded Pension Obligations and Loss of Manufacturing Jobs Among Other Reasons:
Illinois and the Chicago Metropolitan Statistical Area (“MSA”) have had a bittersweet economic climate since 2000.
The Sweet!
- Illinois remains the 5th largest state by population and GDP but the 15th by per capita GDP.
- Chicago MSA in 2015 is the 8th, 6th or 5th largest metropolitan area by GDP in the world (it was 4th in 2008).
- In the Midwest, Illinois has the highest GDP per capita but also the highest public debt per capita, and the highest percentage of public debt to GDP.
The Not So Sweet and Bitter!
- From 1985 to 2000, Illinois and Chicago MSA were competitive with the increase in percentage of personal income and jobs compared to that for the U.S.A. average and the Los Angeles and New York City MSAs.
- After 2000, Illinois and Chicago MSA lagged in the percentage increase in personal income and jobs in comparison to the average for the U.S.A. and New York City and Los Angeles MSAs.
- This could be due to the adverse effects of NAFTA, China joining the World Trade Organization or the economic downturns of 2001 and 2008 and the combined loss of over 75% in value of the Dow from the beginning to the end of the 2001 and 2008 economic downturns.
Since 2000:
- Illinois’ increase in jobs was 17% slower than U.S.A. average.
- Illinois and Chicago MSA had 22-24% less GDP growth than U.S.A. average and higher unemployment rates.
- Due to a sunset of a tax increase in 2015, Illinois income tax collections were reduced by $4 billion in FY2016 compared to 2014.
- Illinois’ unpaid bills were estimated to be $15 billion by the end of FY2017.
- Illinois’ five pension systems unfunded liabilities have increased over 650% since 1995 to about $129 billion by the end of FY2016.
- The Chicago Public Schools purportedly had no unfunded pension liabilities in 2000 and now have as of FY2014 over $9.4 billion unfunded pension liabilities.
- Illinois and Chicago MSA are one of the largest manufacturing areas in the U.S.A. Chicago MSA is the second largest manufacturing area in the U.S.A. Since 2000, Illinois and Chicago MSA lost about 18% more manufacturing jobs than the U.S.A. average. However, the City of Chicago in 2015 added a net 80,000 jobs and a net 60,000 additional jobs in 2016 with an average annual salary of about $72,000 mainly due to company headquarter relocations to Chicago.
- The following charts provide additional detail on the financial distress suffered by Illinois and the Chicago MSA over the last 16 years.
Reduction of Revenue Due to Reduction in Income Tax Rates
Due to a legislation sunset, income tax rates were rolled back from 5% to 3.75% for individuals and from 7.0% to 5.25% for corporations, effective January 1, 2015, plus another 2.5% of net income for corporations as personal property replacement tax.
- After a rate increase in 2010, income tax revenues had more than doubled to $19.8 billion by FY2014 from FY 2010.
- By FY2016, income tax revenues had declined by over $4 billion or 20.7% between FY2014 of $19.8 billion and FY2016 of $15.8 billion.

In the Illinois budget for FY2018 passed in July 2017, income tax rates were increased from 3.75% to 4.95% for individuals and from 5.25% to 7% for corporations, which is anticipated to increase income tax revenues by about $5 billion.
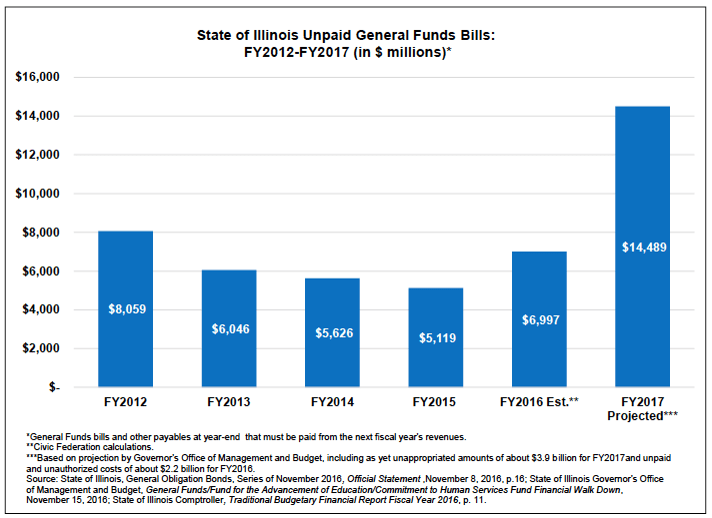
Significant Unpaid Bills
The State of Illinois unpaid bills reached $6.997 billion by FY2016 and are estimated by the Civic Federation in its State of Illinois FY2018 Budget Roadmap February 10, 2017 (herein “Civic Federation”) to reach $14.489 billion by FY2017.
Increaseing Underfunded Pension Obligations Despite Increased Pension Contributions
According to the Civic Federation, by the end of FY2016, the State of Illinois’ unfunded liability for its five pension systems had grown to $129.8 billion based on the market value of assets and funded ratio at 37.6% which is one of the lowest funding ratios among states. In 1995, when the state enacted pension funding legislation, the unfunded pension obligation for the State of Illinois was $19.8 billion.
- Pension contributions from general funds more than quadrupled to $6.9 billion in FY2017 from $1.6 billion in FY2008 and are expected to increase to $7.9 billion in FY 2018 or approaching 25% of the general fund revenue in FY2016.

Michael Cembalest of J.P. Morgan Asset Management, in 2014 and 2016, calculated that approximately 40% of Illinois’ state revenue collected over a 30 year period would be required to pay (a) interest on bonded debt, and the state share of (b) defined benefit plan actuarial required contributions (ARC), (c) retiree health care costs, and (d) defined contribution plan expenses with level payments and a 6% pension investment return.¹ Only 11 other states are above 15% of state revenues collected, and only three states, including Illinois, are above 25%.
Financial Health Measured by Debt to GDP, GDP per Capita, and Public Debt per Capita
While there are various measures of financial health of a sovereign, one of the more traditional is the relationship of debt to Gross Domestic Product (“GDP”), public debt per capita and GDP per capita. The following is an analysis using these measures for Illinois compared to the other Midwest states and compared to California and New York who have the other two largest cities in the U.S.A., and New Jersey, Connecticut and Rhode Island that have or have recently experienced similar financial distress. This analysis demonstrates in the Midwest, that Illinois has the highest public debt to GDP and public debt per capita, but it also has the highest GDP per capita indicating the ability to address financial issues.

Percentage Increase in Personal Income and Jobs
Personal income for Illinois and its major MSA, Chicago, has not increased in recent years at the pace that is the average for the U.S.A. and the metropolitan statistical areas for New York and Los Angeles. Further, the increase in jobs in recent years for Illinois and the Chicago MSA has lagged as compared to the U.S.A. generally and New York MSA and Los Angeles MSA. The following chart indicates that while between 1985-2001, the percentage of increase of personal income and jobs was somewhat comparable for Illinois, Chicago MSA, U.S.A., Los Angeles MSA and New York MSA, that is not true for 2001-2015 and 2007-2015 where Illinois and Chicago MSA’s personal income and job increases lagged the pace of the U.S.A. generally and New York MSA and Los Angeles MSA.

Comparison of Changes in GDP as an Indicator of Financial Condition
Likewise, the percentage increase in GDP for the Chicago MSA was less than that for the U.S.A., or the New York MSA or Los Angeles MSA between 2001-2015.

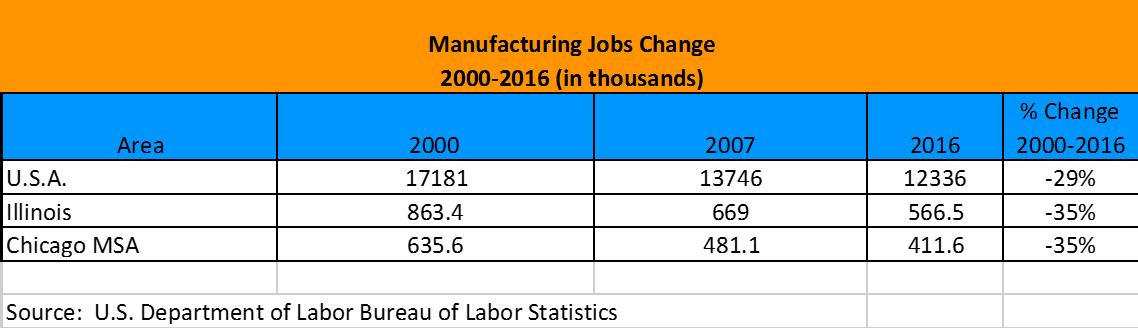
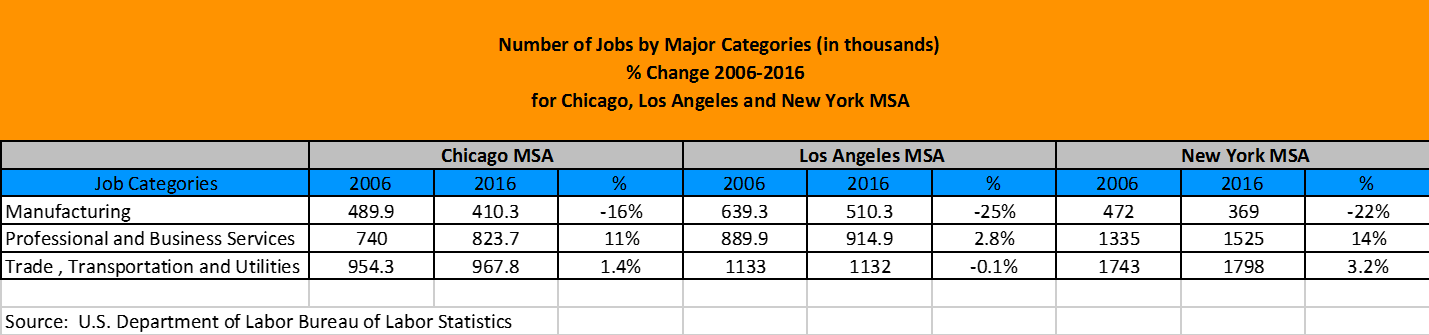
Manufacturing Jobs Lost Since 2000
Illinois is a major manufacturing state and the Chicago MSA is the second largest manufacturing MSA in the U.S.A. Between 2000-2016, the U.S.A. lost 29% of its manufacturing jobs while Chicago MSA and Illinois lost 35%. Among the three major MSAs, between 2006-2016 in the U.S.A., Chicago actually performed better than New York MSA and Los Angeles MSA in reducing the loss of manufacturing jobs and was competitive in professional business services, trade, transportation and utilities. The City of Chicago in the meantime has recently seen a net increase in jobs of approximately 80,000 in 2015 and 60,000 in 2016 with an average salary of approximately $72,000 due in part to a number of major corporation corporate headquarters relocated to the City of Chicago.
Public Pension Underfunding for Chicago and Cook County
Estimate of Combined Pension Underfunding in Chicago Metro Area (Chicago and Cook County):
- The pension fund unfunded pension obligations for the City of Chicago’s four city pension funds was 242.8% of the City revenue for FY2014 or FY2014 revenues for the City were 41.2% of the underfunding.
- When you add the underfunding of pension funds for the Chicago Teachers and the Chicago Park District to the underfunding of the City’s four municipal pension funds, the underfunding was 364.5% of the City’s revenues for FY2014 or FY2014 revenues for the City were 27.43% of the underfunding.
- The pension underfunding for Cook County for FY2014 was 391.69% of Cook County’s FY2014 revenues or Cook County revenues for FY2014 were 25.5% of the FY2014 underfunding of pensions.
- For all City of Chicago and Cook County major government pensions, the FY2014 underfunding was 382.95% of FY2014 revenues for the County and the City or FY2014 combined revenues for the City and the County were 26.112% of the FY2014 pension underfunding of their pensions.

Illinois and its municipalities since 2007 have suffered from the adverse effects of the Great Recession, lagging personal income increases, loss of traditionally key industry jobs such as in manufacturing, slower growth in GDP due to lagging personal income increase and loss of jobs. What action can state and local governments take to reverse their economic downturns and financial challenges? In the next part of this series, we will analyze the alternatives states can take to monitor and provide oversight and assistance to financially troubled municipalities.
¹The ARC and the Covenants: Assessing the Ability of States to Service Debt, Pension, and Retiree Health Care Costs in a World of Finite Resources. Michael Cembalest, J.P. Morgan Asset Management, June 2014
James E. Spiotto, Co-Publisher © James E. Spiotto. All rights reserved. The views expressed herein are solely those of the author and do not reflect the position, opinion or views of Chapman and Cutler LLP or Chapman Strategic Advisors LLC.
It is clear that the challenges that Illinois and its municipalities find themselves facing have not come about due to any one decision, action or inaction, or stakeholder group. Numerous decisions by various parties, as well as external forces, have led to the current state of affairs. Fortunately, there are solutions to such problems that can be implemented, which will be the focus of Part II in MuniNet Guide’s series on Overcoming Economic Downturns and Fiscal Distress.
Up next…Alternatives Available to the State of Illinois and Its Municipalities to Monitor and Provide Oversight and Assistance to Financially Troubled Municipalities
Click here to read the introduction to this series, “How State and Local Governments Can Overcome Economic Downturns and Fiscal Distress”