MuniNet Guide Co-Publisher James Spiotto Looks at How We Got Here, Where We Can Go, and How States Are Working to Trim Expenditures While Working on Policy Goals
by James Spiotto
Over the past sixteen years we have had two recessions (2001 and 2007), the implementation of the North American Free Trade Agreement, China joining the World Trade Organization, with increased outsourcing by U.S. corporations, all of which in part contributed to reduction of state and local government revenues, and in particular tax revenues lost due to a significant loss of manufacturing and manufacturing-related jobs caused by automation and outsourcing. At the same time, there has been increased public pressure to reduce or cap taxes or at least to reduce the growth of taxation. Further, there has been ever clearer recognition of the need for increased funding of too long delayed infrastructure investments, and enhancement of government services that require additional tax revenues. All of these have added to the burden of state and local governments not only to balance budgets, but also pass budgets and necessary legislation to bridge economic downturns and enhance economic development. While financial distress of state and local governments is rare it does occur, and can be prevented. Chapter 9 Bankruptcy for local governments is the last resort, and should at best, for good reason, be seldom used.
Since the economic downturns of 2001 and 2007, and accompanying economic pain, a number of states have had difficulty passing a budget before the start of the fiscal year. As noted by the National Conference of State Legislatures, between 2002 and 2010, nineteen states have started one or more new fiscal years without a budget, and five of them experienced partial government shut downs¹. In 2011, California, New York, and Pennsylvania did not pass their budgets by the start of their fiscal years. Most recently, New Jersey, Connecticut, Pennsylvania, and Illinois have failed to pass a budget in a timely manner.² Illinois, after a two-year battle, finally just passed a budget, albeit with some lingering controversies. Passing a budget is not the solution to fiscal problems, but merely a necessary first step to provide financial stability. There are additional necessary actions, policies, and programs that can expedite the recovery process.
At the Bond Buyer’s Midwest Municipal Market Conference last June, MuniNet Guide’s James Spiotto provided background on how state and local governments can deal with and overcome fiscal distress. This multi-part series will discuss the gathering storm over the past 16 years in Illinois, Chicago, and the Midwest in general. Between 2000-2016, Illinois, Chicago, and other Midwest states and municipalities suffered from lagging growth in gross domestic product, personal income, and jobs compared to the average in the U.S.A.
Recent financial and business experiences in the U.S. appear to be changing for the better, and the needed passage of a budget for Illinois could indicate that the financial road may be turning and the adventure down the road to economic recovery may be beginning. But one step does not make a completed journey. State and local governments like Illinois and Chicago need to consider each appropriate step toward overcoming economic down turns, creating increased financial and business activity, and establishing the policies and programs that increase revenues, enhance governments services, and allow for investment in needed infrastructure improvements, in order to attract new businesses, create new good jobs, increase personal income and GDP growth, and provide the needed, new, additional tax revenues that are the hallmark of recovery.
While government expenditures should always be efficient and effective, and without waste or unnecessary costs, severe budget cuts and raising taxes has historically never been the best response to deficits and financial distress. As we know from Detroit, Bridgeport Connecticut, and other financially distressed municipalities, if taxes are raised and services reduced in an effort to eliminate budget deficits, you discover the deficit is not eliminated, and most likely will increase. Corporate and individual tax payers facing less services for higher taxes leave the municipality for friendlier jurisdictions. Further, the more taxes are raised, the more needed services are reduced the fewer taxpayers remain. The result is less not more tax revenues collected, and larger budget deficits, which is the beginning of a death spiral if not corrected. The purpose of this series serves to explorer what can be done by state and local governments to avoid financial distress, and any death spiral environment.
This series of articles provides a discussion of certain actions, policies, and programs that should be considered by state and local governments as they embark on the recovery process. In addition to these topics, this article and the rest of the series will discuss:
I. The Gathering Storm: The Systemic Causes of Financial Distress in the Midwest, The State of Illinois, and its Municipalities Since 2000
II. Alternatives Available to the State of Illinois and Its Municipalities to Monitor and Provide Oversight and Assistance to Financially Troubled Municipalities
III. Solving Financial Distress with Economic Development and Stimulus from Needed Infrastructure Improvements and Reinvestment in States and Municipalities
IV. The Need for Increasing the Financial Credibility of the Financially-Challenged State and Municipality by Use of Statutory Liens and Special Revenue Legislation to Lower Borrowing Costs and Increase Market Acceptance
V. Need for Timely and Complete Continuing Disclosure on Material Events during Financial Distress of State and Local Government
VI. The Need to Successfully Address Legacy Costs So That Funding of Essential Services and Needed Infrastructure Improvement Become the Solution
VII. Business Development and Balance Budgets for State and Local Governments
VIII. Upside Chicago – Creation of 10-18 Industrial Parks in the Chicago Area Creating 20,000 New Good Jobs for about 100-140 new or Relocated Companies
IX. What Oversight and Assistance Does Illinois Presently Provide for Financially Distressed Municipalities and What Present Legislative Proposal May Provide?
X. Legislation Pending Before 100th General Assembly of the State of Illinois Provides Promising New Law Relating to Monitoring, Oversight and Assistance to Distressed Municipalities, Use of Neutral Evaluator and Chapter 9 Option as Well as Technical Assistance to Address Systemic Problems and Increase Financial Market Access and Lower Borrowing Costs
XI. What Should We Take from All of This?
Financial Distress of State and Local Governments is Rare but It Does Occur:
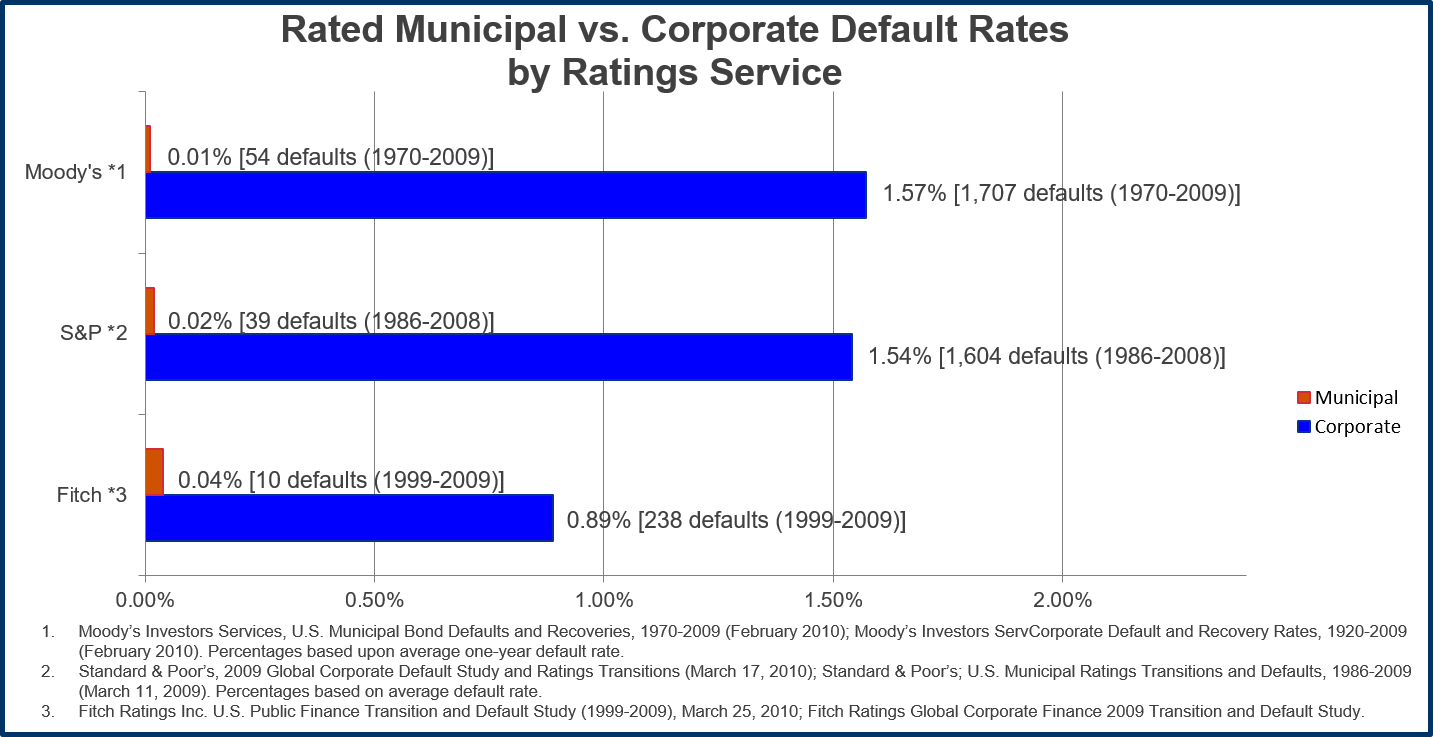
The default rate for rated state and local government bond debt is 1/50 to 1/100 (1 or 2%) of that of the rated corporate bond defaults. The rate of Chapter 9 bankruptcies for municipalities is actually .086% of corporate Chapter 11 filings or 8.6/10,000 of that of corporate Chapter 11 per year over the last 36 years.
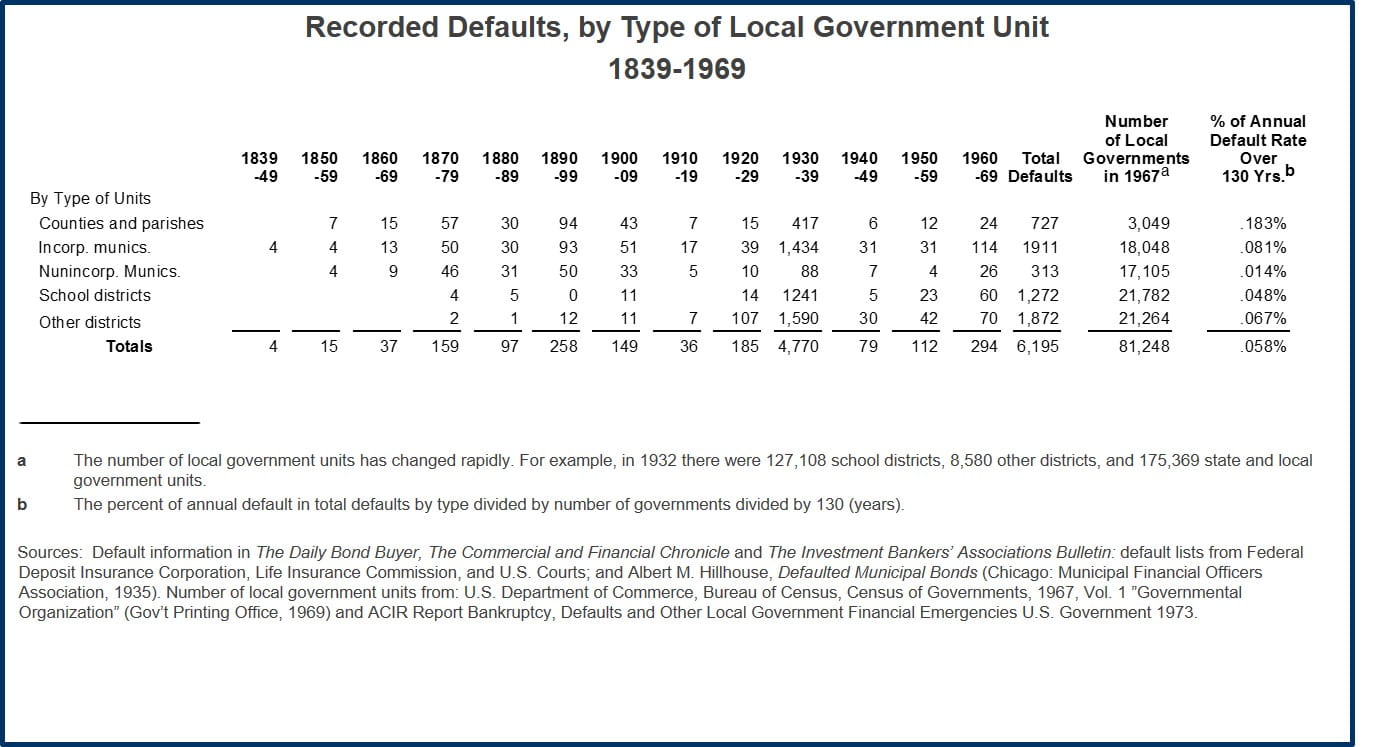
History of past default trends
Historically, while political risk of non-payment was a possibility, it was a rare occurrence, if not in reality a non-existent concern, with a few exceptions (i.e., 8 states and one territory repudiated their debt between 1841 to 1843 with 7 of the 9 resuming payment by 1849, repudiation of Civil War related debt by 8 states in the late 1860’s, railroad bond and real estate defaults of the 1870s to 1890s and Washington Public Power Supply System, 1983). There are recent situations that may test the long-term viability of the historical premise. Namely, it is hoped that Detroit, Stockton, San Bernardino and Jefferson County and Puerto Rico are rare aberrations rather than indicative of a growing trend.
Recent Default Rate: Historically, there is a low default rate for bonds issued by municipalities and states and studies of recent default since 1970 continue the trend:
The late Dr. John Petersen of George Mason University noted in his paper on “Municipal Defaults: Eighty Years Made a Big Difference” (2011) that, between 1970’s-2000’s, the municipal default for municipalities averaged per decade .10% to .24% (adjusted for WPPSS and Jefferson County, Alabama) not including the fact that over 80% of the defaults were conduit financings and not essential public financings. This is a far cry from the corporate bond default rate on average for investment grade and non-investment grade of about 10%. (Petersen, 2013).
States have not defaulted on general obligations bonds since the late 1880’s, with the exception of Arkansas debt in 1933, which was thereafter refinanced.
U.S. Municipal Defaults and Recovery 1970-2014:
Moody’s report on U.S. Municipal Defaults and Recovery 1970-2014 further supports a lower default rate and higher recovery than on corporate bonds and found:
- Municipal bond defaults for rated bonds remain extremely low namely 1.3 defaults per year on average between 1970-2007 period (0.01%) and 5 defaults per year from 2008-2014 period (7 in 2014 and 5 in 2012 with an average of 5 defaults) or 0.03%.
- The ultimate recovery rate remains higher than on corporate defaults with at least 60% recovery for the 1970-2014 period for municipal rated bonds versus 48% recovery for corporate senior unsecured rated bonds. Ranges vary by case – Jefferson County at least 80% for sewer bonds class, 100% of principal for G.O. warrants: Vallejo, Sierra King – 100% recovery for special revenues.
- Recently, monetary defaults on state and local government public debt ranged from 108 issuers for $1.95 billion in default in 2012 to 68 issuers for $8.57 billion in default in 2013 to 58 issuers for $9.02 billion in default in 2014. (Municipal Market Advisors). While there was a decline in the number of issuers in default by almost 50%, there was however the rise in dollar value of defaults in 2013 and 2014. This was due to Detroit’s filing for bankruptcy and defaulting and a large energy company bankruptcy. For example, $5.4 billion of the $9.02 billion in default in 2014 were the Detroit water and sewer bonds that ultimately were unimpaired in the plan of debt adjustment. In addition, TXU, a subsidiary of Energy Future Holdings Company, declared bankruptcy in April 2014, which filing caused the default on $1.16 billion of industrial development bonds
The Willingness to Pay vs the Inability to Pay
Historically, based on default rate, willingness to pay has not been a real problem but current events may test that premise. Essential service debt financing has historically enjoyed a significantly lower default rate than healthcare, housing and conduit state and local governmental financing. Unfunded pension obligations and deferred infrastructure costs are a more recent phenomenon – Prior to 1960s, most pension obligations were treated as gratuities and a significant number of big ticket infrastructure costs are only now starting to age such as the interstate highway system, electric grid, waste water treatment facilities, etc. We are closer to a tipping point and departure from the historical assurances than we have ever been. The difference may be whether there will be adherence to the Washington-Hamilton principle of honoring the payment of public debts and reinvesting in state and local government going forward.
In responding to financial distress and attempts to balance budgets, it is critical to be aware of traditional causes of financial distress, and some new developing causes that should be avoided if at all possible.
Traditionally causes of municipal bond defaults in the U.S.A. have been more linked to inability to pay rather than unwillingness to pay or political risks:
- Economic depression
- Non-essential services
- Feasibility of projects and municipal enterprises
- Fraud
- Mismanagement
- Natural and man-made disasters
New developing causes of financial distress for state and local governments:
- Deferred costs of capital improvements and infrastructure costs.
- Decline of urban areas — Loss of population and business development.
- Proposition thirteen mentality — The popularity of tax caps and limitations and the problem with them in economic downturns.
- Off balance-sheet liabilities — Unforeseen judgments and derivatives problems.
- Unaffordable and unsustainable personnel costs due to lack of growth in population and business development.
The Big Question: Willingness to pay versus ability to pay
Causes of Chapter 9 to be noted and avoided:
- Deferred costs of capital improvements and infrastructure costs. (Detroit and Central Falls)
- The bursting of the local government debt bubble. (Jefferson County and Detroit)
- Decline of urban areas. (Detroit and Central Falls)
- Proposition thirteen mentality — The popularity of tax caps and limitations. (Stockton and San Bernardino)
- Unaffordable and unsustainable personnel costs. (Vallejo, San Bernardino, Detroit)
- Lingering legal issues and surprise court decisions. (Town of Mammoth Lakes and Boise County, Idaho)
- Off balance sheet liabilities. (Underfunded pension obligations – Stockton, San Bernardino, Detroit)
- Willingness to pay vs. ability to pay — Willingness to pay traditionally has not been a problem but could be a growing concern. (Jefferson County, Orange County, etc.)
The next article of this series will explore the Gathering Storm and the recent systemic causes of financial distress for state and local governments.
Next, The Gathering Storm: The Systemic Causes of Financial Distress in the Midwest, The State of Illinois, and its Municipalities Since 2000
James E. Spiotto, Co-Publisher © James E. Spiotto. All rights reserved. The views expressed herein are solely those of the author and do not reflect the position, opinion or views of Chapman and Cutler LLP or Chapman Strategic Advisors LLC.
¹Late State Budgets – National Conference of State Legislatures, August 27, 2010.
²FY 2016 State Budget Status – National Conference of State Legislatures, October 08, 2015