Annual Census of State and Local Public Pensions Shows Discouraging Investment Returns, Declining Assets
The U.S. Census Bureau has released its 2016 Annual Survey of Public Pensions, which provides a comprehensive look at the financial activity of the nation’s state and locally-administered defined benefit pension systems, including cash and investment holdings, receipts, payments, pension obligations and membership information. A defined benefit plan is a retirement plan in which the employer promises to make a set pension benefit payment or lump sum, usually determined by some formula based on earnings, age, tenure, and other characteristics of the employee.
Topline numbers show that employer pension contributions made by state and local governments increased by 6.5 percent, or $8.5 billion, while earnings on investments dropped by $105.7 billion to $49.9 billion, a decline of 67.9 percent. Earnings on investments include both realized and unrealized gains, and therefore reflect market fluctuations.
In 2016, the total number of beneficiaries of state and local government pensions increased 3.3 percent to 10.3 million people, from 10.0 million in 2015, and 9.9 million people in 2014. The benefits they received rose 5.4 percent to $282.9 billion in 2016, from $268.5 billion in 2015. Corresponding in part with weaker earnings, increased beneficiaries, and increased total benefits, total state and local pension assets decreased 1.6 percent, to $3.7 trillion in 2016, from $3.8 trillion in 2015.
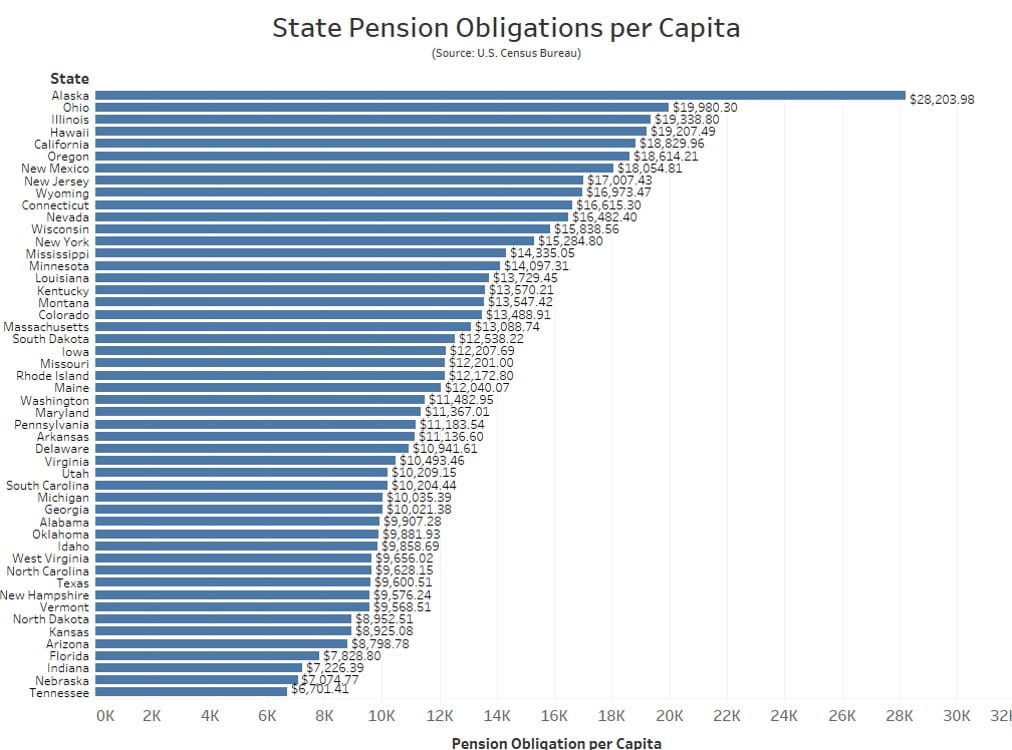
MuniNet also took a look a deeper look at the data files and calculated the total state pension obligations per capita in 2016. We did not look at local pension obligations per capita, because the Census Bureau only reports pension obligation data at the state level. Furthermore, Census aggregates local data at the state level, meaning ‘local’ is reported in total for the entire state. For example, Census reports that the sum of all earnings on investments of local governments in the State of New Hampshire totaled $85.6 million in 2016. However, the performances could vary so widely from government to government within a single state, that making per capita calculations of local totals across the state is in many cases not very valuable. Further complicating matters is the state-by-state variance in the degrees to which state governments are actively involved in, and may be on the hook for, local government pension obligations. Finally, it should be noted that state-level Census data aggregates all state pension funds. Some states have a single system that manages retirement funds for all employees, and others have separate funds for teachers, police, general government employees, and others. Readers should visit the charts and articles on MuniNet’s Public Pensions and Fiscal Distress pages, which are excellent resources for further research.
Returning to state pension obligations, we graphed and listed each state with it’s per capita obligation figure. Tennessee has the lowest amount of per capita obligations, with $6,701. Alaska has by far the highest, with $28,204 in state pension obligations per capita. Alaska‘s issues with underfunding and poor investment returns are well-documented, but other states like Illinois and Kentucky have similar challenges. What makes Alaska‘s per capita obligations so dramatically high is a combination of poor fund performance/management, as well as the state having a particularly large number of its workforce employed by the state government. As of 2104, Alaska has by far the highest number of full-time State employees per 10,000 residents. Tennessee, by contrast, ranks 40th among all states on this metric, and as of 2014 has the fourth-highest State pension funding ratio (99%).
Click to Expand
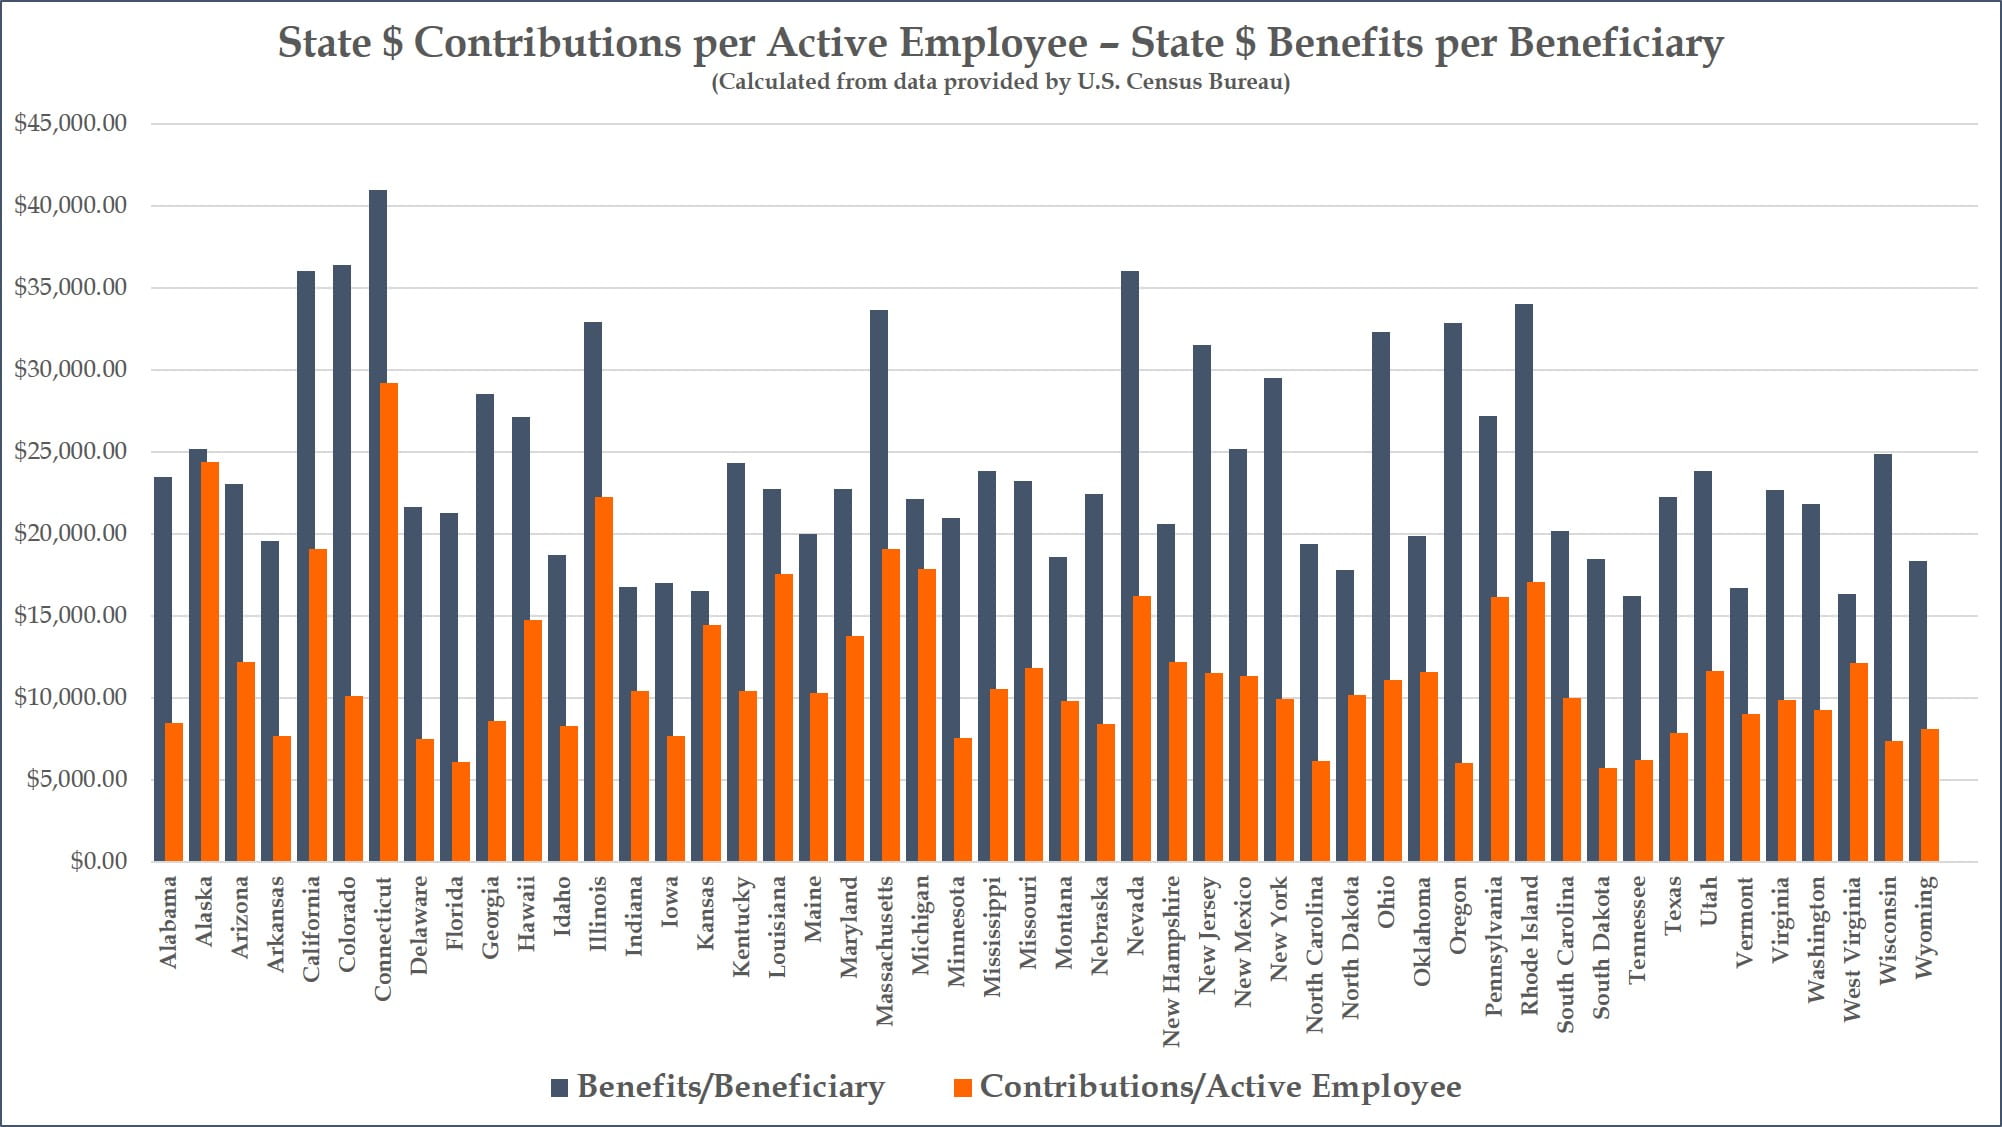
Delving deeper into the Census data, we can look at the relative amount each state contributed in 2016 per active employee, and the amount in benefits it paid out per beneficiary. The chart below shows all 50 states in alphabetical order, with the blue bars representing benefits per beneficiaries receiving monthly or periodic payments, and the orange bars representing the contributions per active employee. Per Census data, beneficiaries receiving one-time lump-sum payouts are not included in these calculations, but includes any beneficiary receiving periodic payments, whether retired on account of age, service, disability, or survivors of deceased beneficiaries. Contributions include both employee and employer contributions, including earnings on investments.
Contributions do not include any funds received that are dedicated to other social insurance programs, such as Social Security, or proceeds from liquidation of assets. Active employees are employees currently employed by the State government, and earning credit through their service towards future pension benefits; the vast majority are also making active contributions, but some are exempt. A third group, inactive employees, are not represented here. These are former employees who have earned some future benefit, but are not current beneficiaries, such as people still in the workforce of working age, currently employed elsewhere. More details on Census definitions of employees, financial metrics and other statistics of federal, state, and local governments can be found here.
What stands out is not only the remarkable variance in the proportional size of contributions and benefits by state, but the variance in how contributions and benefits align. In 2016, Connecticut had the highest benefit payout per beneficiary ($40,943.96) of all states. However, it also had the highest contributions per active employee ($29,152.91), although this is not enough to keep pace with benefits. Meanwhile, the state with the second highest benefits payout per beneficiary, Colorado ($36,357.57) committed only $10,119.71 in contributions per active employee.
Click to Expand

At right is a graphic showing the ratio of benefits per beneficiary over contributions per active employee for each state. Meaning, the figure for each state represents how many dollars are paid out in benefits per beneficiary in 2016 per dollar of contributions per active employee. Alaska, with its high pension obligations per capita, actually has be best ratio in the nation for 2016, only paying out $1.03 in benefits per beneficiary per dollar in contributions per active employee. Alaska has relatively modest benefit figures when calculated per beneficiary, and its near parity between benefits and contributions is at least in part influenced by the fact that the state passed 2006 legislation changing from a defined benefit to a defined contribution plan for future state employees.
Oregon certainly had to stretch its contribution dollar the furthest in 2016, as it paid out $5.47 in benefits per beneficiary for every $1.00 in contributions per active employee. Oregon is one of the only states that requires no employee contributions toward the pension fund. Employees are required to contribute six percent of their earnings towards retirement, but rather than going towards the pension fund, these earnings are put into a defined contribution plan similar to a 401(k), that is personally set aside for the employee.
Increased contributions by employees and government are needed to help states get ahead and stay ahead of pension costs that place too high a burden on resources, potentially threatening public services. Weak earnings figures in 2016, as well as the large discrepancies for some states between contributions in and benefits out, demonstrate that many state and local governments are still not going far enough to secure fiscal sustainability of their pension systems. Earnings on investments will have strong years and weak years, but too many states are still in a very deep hole regarding future pension obligations. States trying to play catch-up cannot and ought not count on strong market returns to fix their pension problems.
by Jeffrey L Garceau