MuniNet Data Shows Growth in Metro Labor Force Trends among Largest U.S. Metropolitan Areas.
by Jeffrey L Garceau
When discussing the health of the economy, the media typically pays attention to three metrics: unemployment rate, net jobs numbers, and gross domestic product (GDP). MuniNet discusses these figures as well, and they are worth measuring and analyzing. However, they do not paint a comprehensive picture and may understate the simplicity of tracking the growth in the number of persons available to work as well as the rate in which a metro areas generate new jobs.
Labor Force in Largest U.S. Cities
Over the most recent one year period (Jan 2016 – Jan 2017) reported by the Bureau of Labor Statistics, the Atlanta-Sandy Springs-Roswell, GA metropolitan area saw its labor force expand by the fastest rate among the 11 largest areas in the nation. Dallas-Fort Worth-Arlington, TX, the leader in labor force expansion over the past five and eight year periods, slipped to second place. Tied at the bottom of the big metro areas was the Chicago-Naperville-Elgin MSA and New York- Newark- Jersey City MSA.
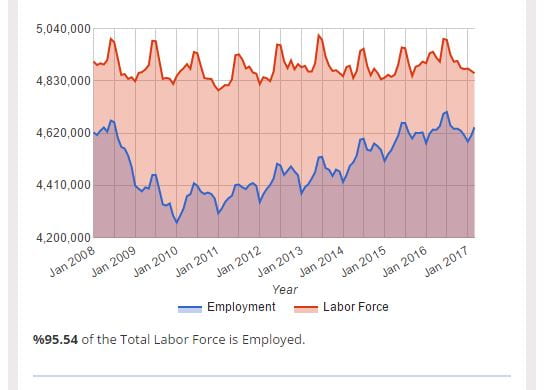
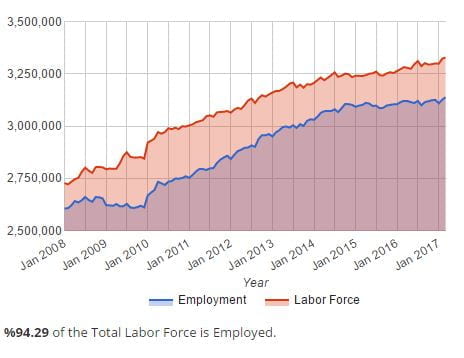
Below the Chicago IL MSA is shown as an example of the employment data available on each Metropolitan Statistical Area in the U.S. total labor force and total employment are displayed. Additionally, although it is not displayed here, you can scroll over a data point, and get month-by-month figures.
Chicago, IL Labor Force – January 2008-March 2017
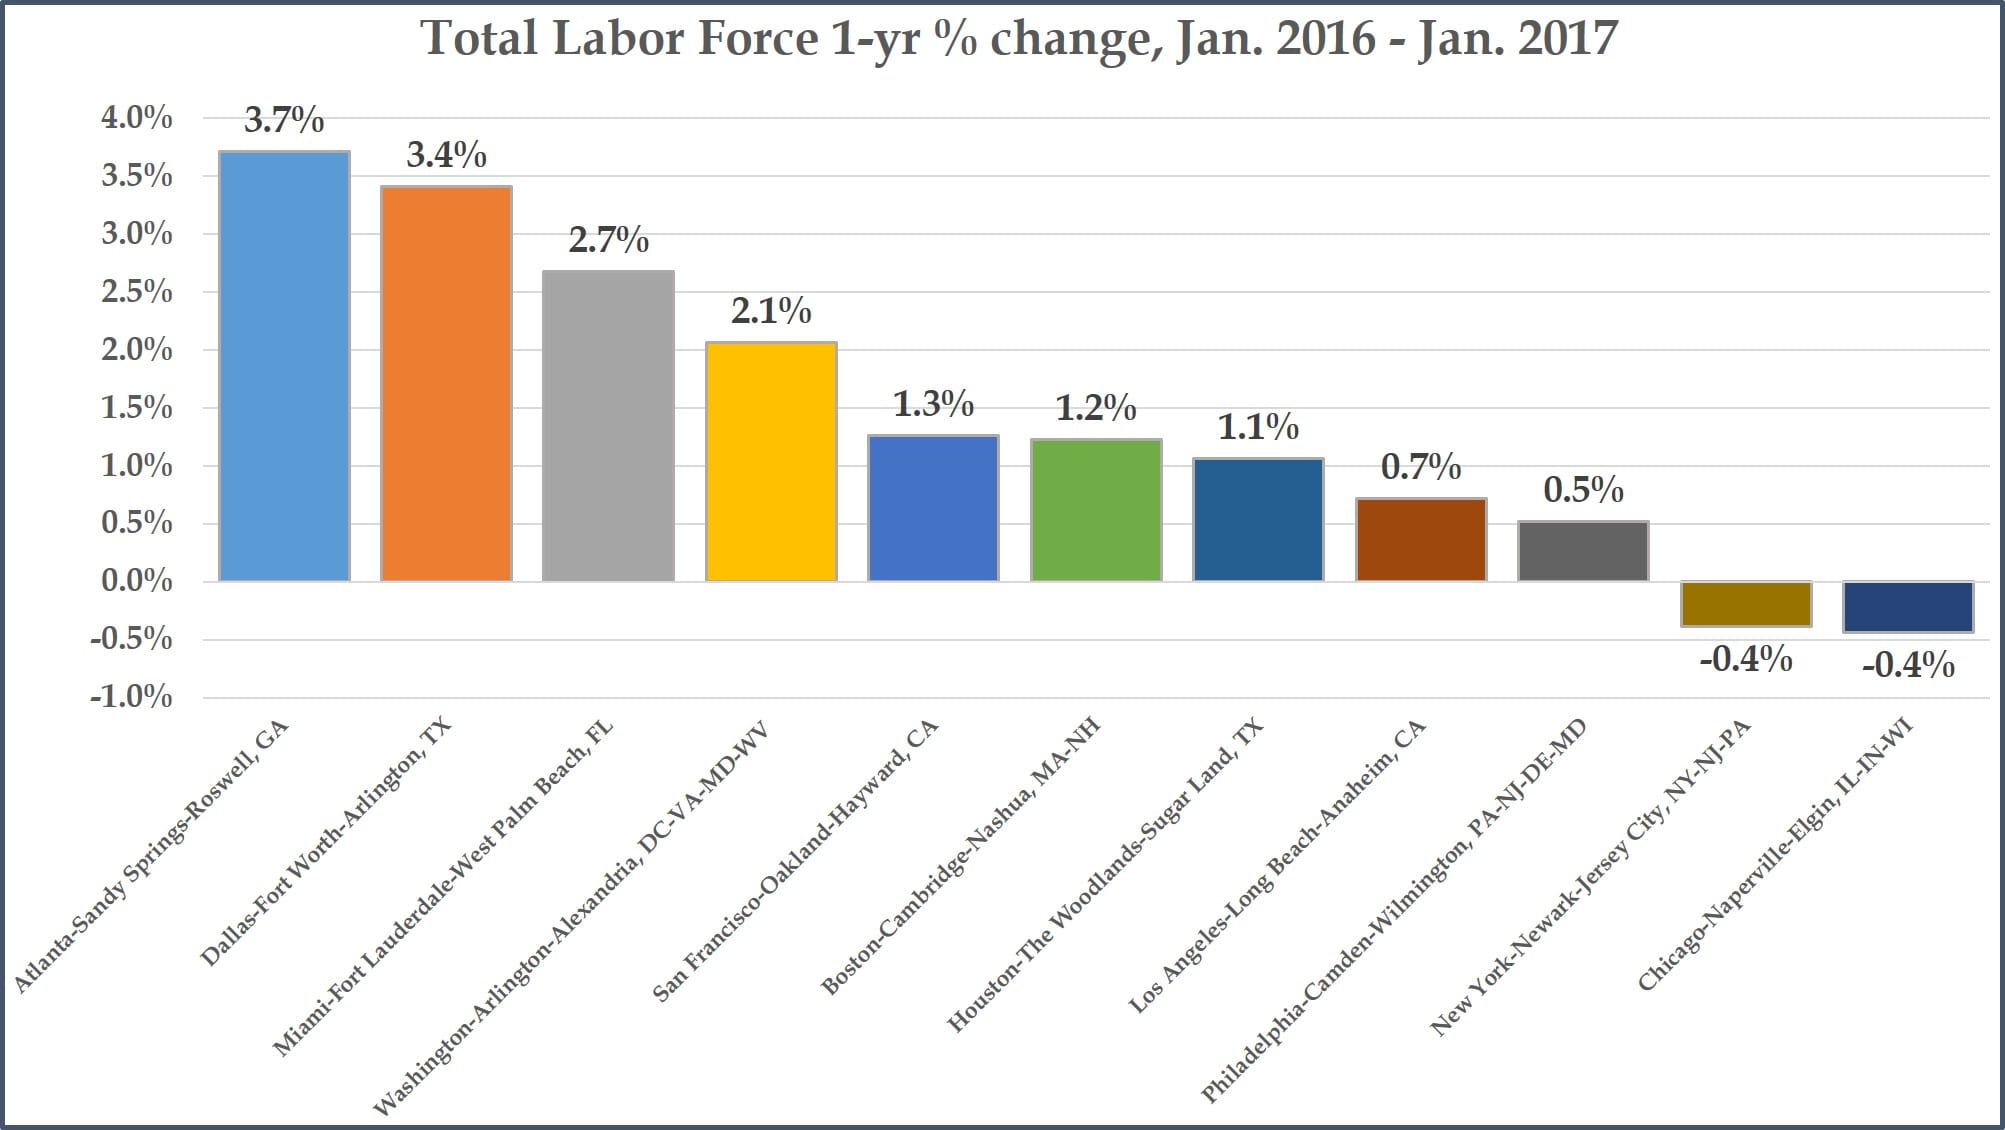
The graphs at right show the percentage changes in the total labor force for the 11 largest Metropolitan Statistical Areas in the U.S. These include the MSAs with the central cities of New York, Los Angeles, Chicago, Dallas, Houston, Washington, Philadelphia, Miami, Atlanta, Boston, and San Francisco. The first graph shows the one-year percentage change from January 2016-January 2017, the second shows the five-year percentage change from 2012-2017, and the 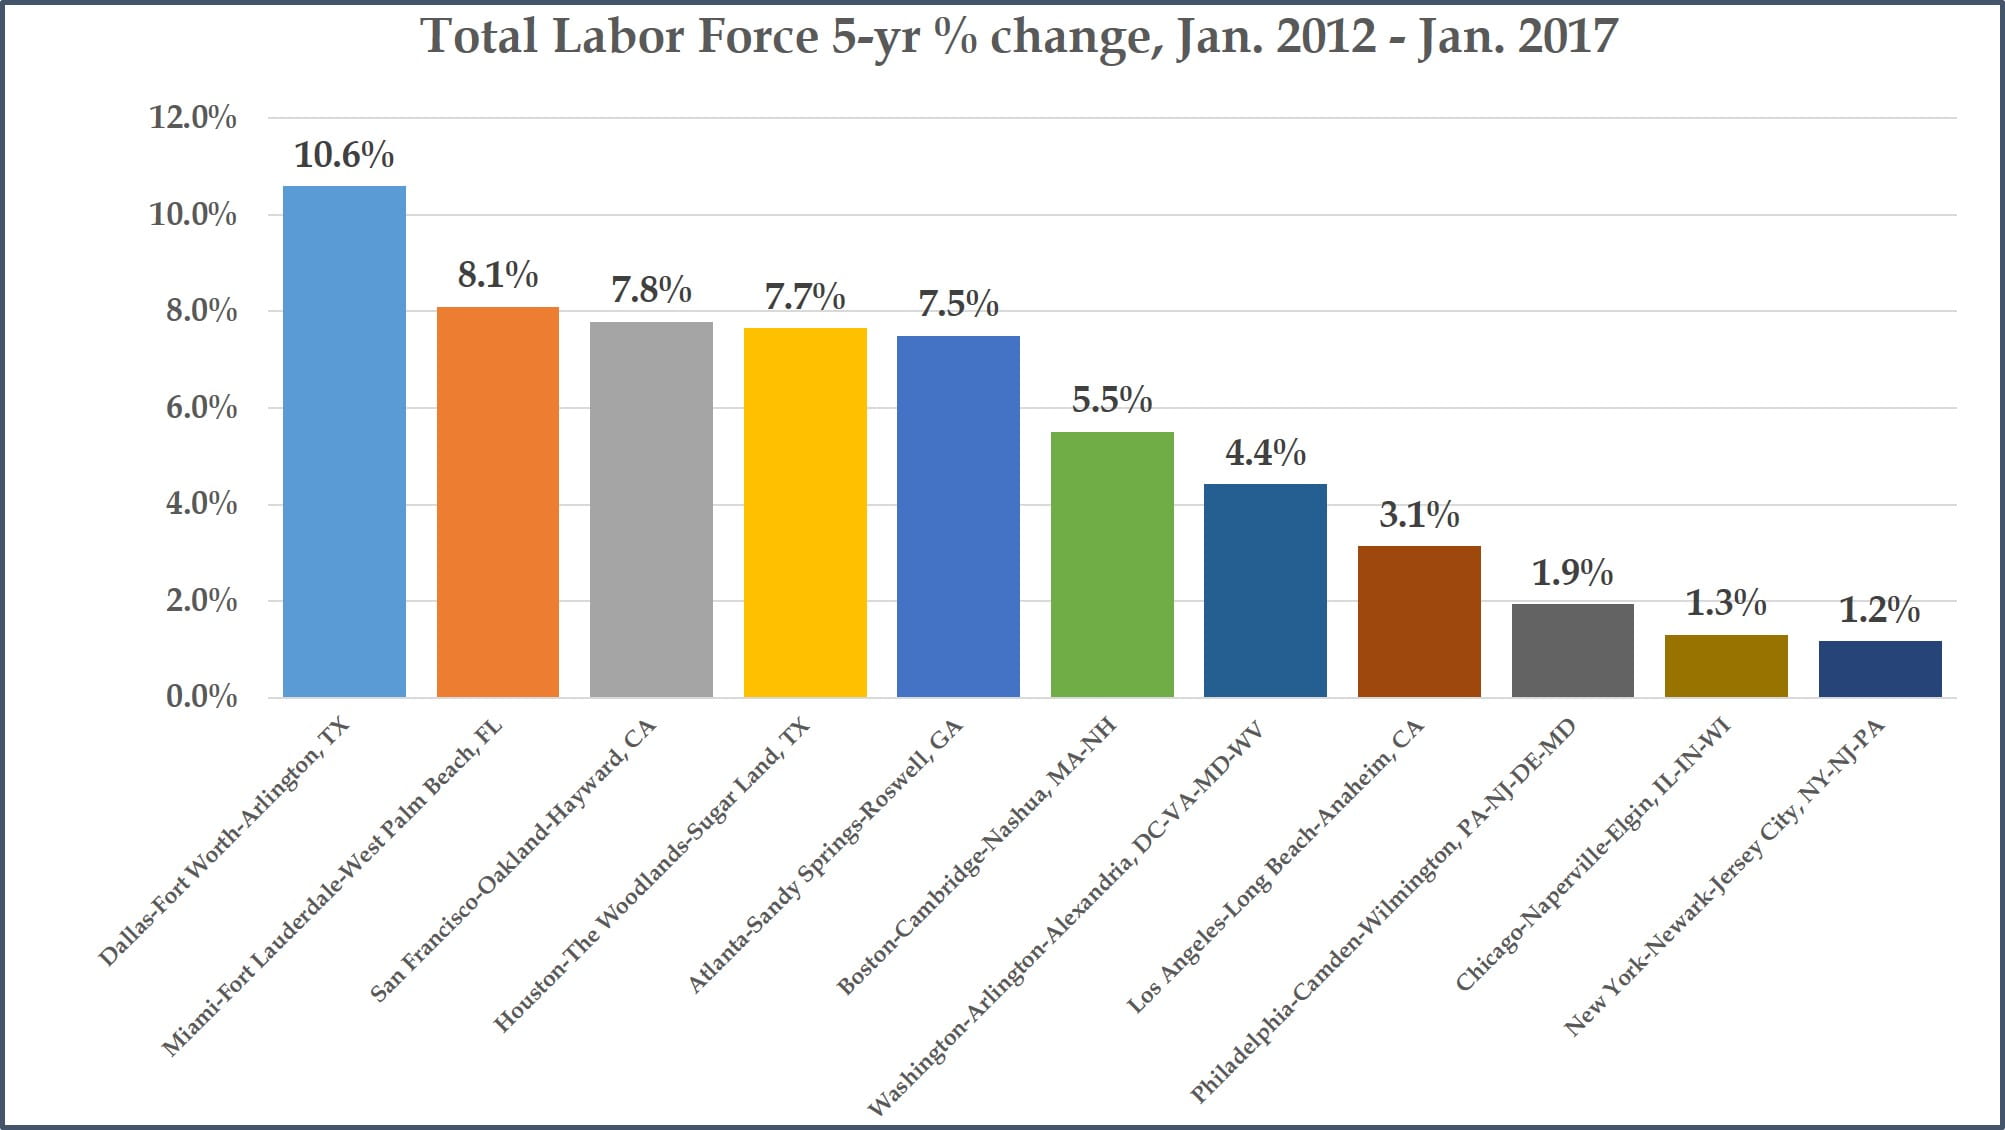 third the eight-year percentage change from 2009-2017.
We see that the total labor force for the New York and Chicago MSAs actually shrunk over the past year. Atlanta MSA’s labor force increased by 3.7%, the fastest rate among these metropolitan areas. Atlanta MSA still shows relatively healthy five-year growth of 7.5%, but Dallas MSA overtakes it, and has had a noticeably faster expanding total labor force, with a percentage increase of 10.6% 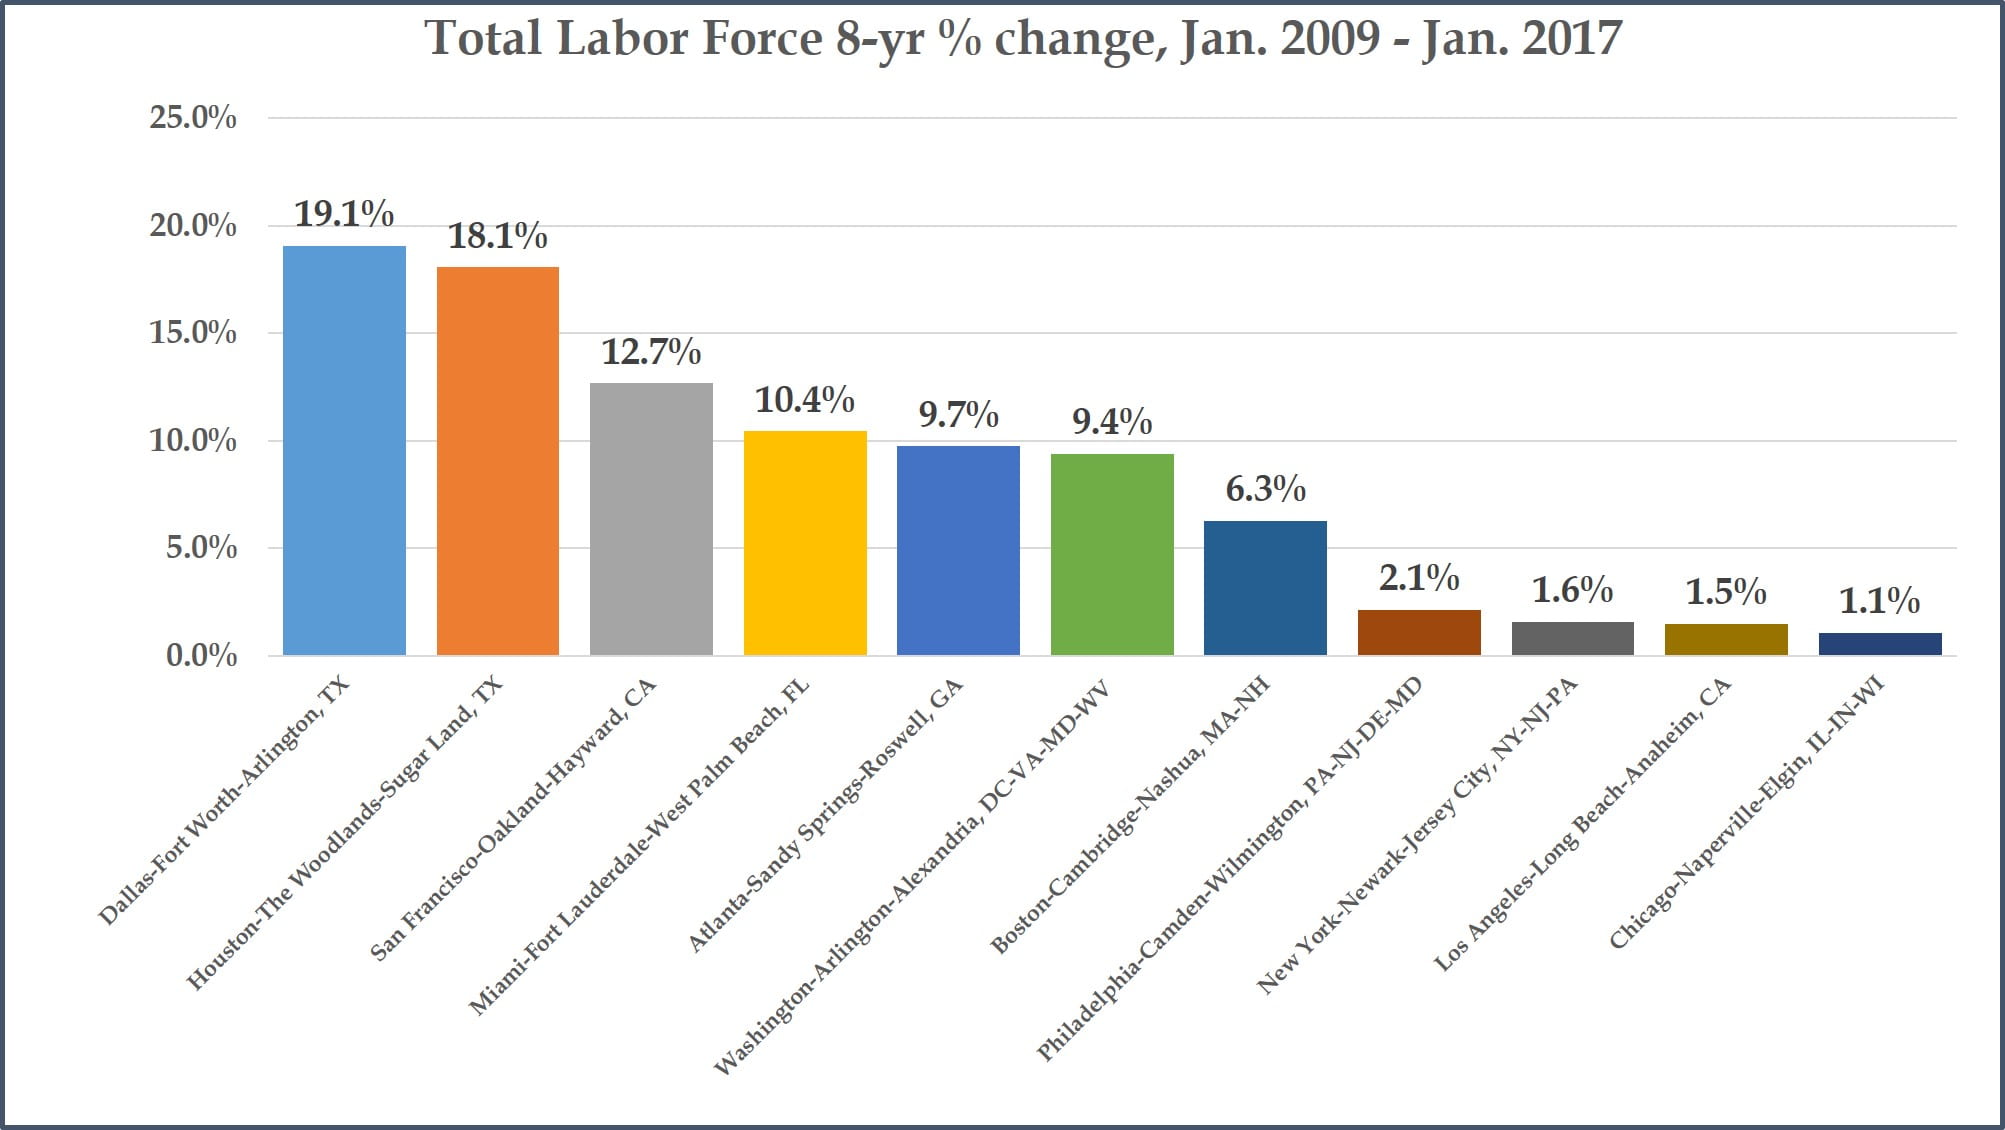 from 2012-2017. Miami MSA has the second fastest rate, of 8.1%.
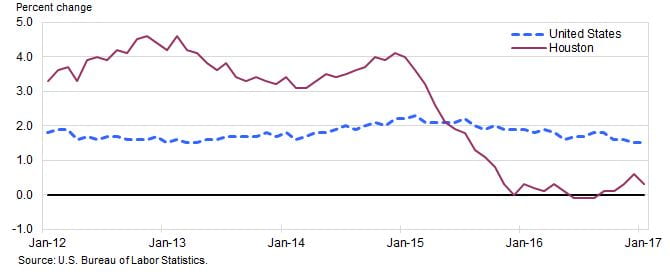
Generally, the varying pace of labor force growth follows regional patterns we would expect to see; faster growth in southern and western MSAs, and slower growth in the northeast and midwestern MSAs. What is most notable is the deceleration of labor force growth in the Houston-The Woodlands-Sugar Land, TX. Although its labor force has grown by a remarkable 18.1% since 2009, its rate slows down to 7.7% when looking at data since 2012, and down to only 1.1% growth last year. Among the 11 MSAs analyzed, it went from having the second fastest 8-year growth, to fourth fastest 5-year growth, to seventh fastest 1-year growth.
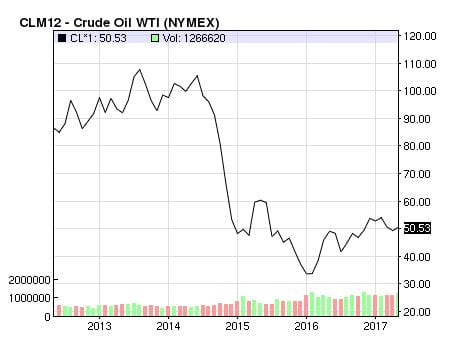
Three charts reveal part of the explanation for this change. The first chart, which comes from MuniNet’s Houston-The Woodlands-Sugar Land, TX MSA Employment Data Page, shows a flattening of the pace of growth in Houston’s total labor force and total employment growth. The second chart, generated directly by the Bureau of Labor Statistics, shows the month-by-month percentage changes in Houston MSA’s labor force, which shows a steep drop off starting around the beginning of 2015. The third chart, provided by NASDAQ, shows the price of crude oil over the past five years. A similarly sloped drop off in the price of oil occurred in mid-2014. Clearly, there is a correlation between the drop in oil prices, and the labor force growth of the Houston metropolitan area.
Three metrics that are also very important measurements of economic health for states and cities are total labor force, total employment, and labor force participation rate. MuniNet Guide provides ten years of total labor force and total employment numbers for all 388 U.S. Metropolitan Statistical Areas, as distinguished by the U.S. Bureau of Labor Statistics. In this article, we will focus on analyzing trends in total labor force, using data available in MuniNet’s Employment Database. As a case study, we will feature the 11 largest U.S. Metropolitan Statistical Areas. Future articles will focus on total employment and labor force participation rates.
The Labor Force
The total labor force is the number of individuals either currently employed or actively looking for work (meaning looking within the past four weeks). Children under 16 years of age and incarcerated individuals are removed from the formula. For a given state or city/metropolitan area, a growing labor force indicates that either the total population is growing, or that more people among the current population are entering the labor force, or both. A growing labor force due to a growing population could indicate that people are moving into a state or city, which is a sign not only of current positive economic activity, but future prospects. Organic population growth could mean a high birth rate, which in turn could indicate a large percentage of the population being young families. More of the population entering the labor force is a sign of positive prospects; people believing they have a decent chance of finding work, and desiring work.
Looking at the total labor force can add depth to one’s analysis of unemployment figures; it is possible that if people are entering the workforce at a high enough pace, they could be actually causing an unemployment rate to hold steady, or even rise in the short term. The unemployment rate shows how many people are in the labor force but not employed. A strong economy and labor market could see people entering the workforce at a faster rate than they are finding jobs. If one only looked at the unemployment rate, they could get the impression that an economy is stagnant or showing signs of slowing down, when in fact it is heating up.
You can search employment data for all fifty states as well as all U.S. Metropolitan Statistical Areas at our Employment Data page. You can also access population numbers and other demographics information on our Cities & States search engine.
by Jeffrey L Garceau