Western States and Deep Southeast See Strong 2016 State GDP Growth, Oil Reliant States Suffer Declines
This week, the U.S. Bureau of Economic Analysis released their Gross Domestic Product numbers for each state and region for the fourth quarter of 2016 and the 2016 calendar year. Although 2016 state GDP figures increased in 43 states plus the District of Columbia, growth overall slowed to 1.5 percent in 2016, down from 2.6 percent in 2015. These national numbers are slightly different from the numbers commonly reported for the U.S. in other reports, as they do not include overseas economic activity of the Federal government. However, the general trend of growth decline in 2016 is consistent.
All fifty states and D.C. had a growing GDP in the fourth quarter of 2016. Seven states had the five highest growth rates, with Texas taking the top spot, with 3.4 percent growth. The top seven included all three states on the western seaboard, as well as two other states west of the Rocky Mountains, Utah and Idaho. Seven states also share the five lowest growth rates, with Mississippi having the slowest growth rate of 0.1%.
Biggest Movers – State GDP % Change 4th Quarter 2016
TOP FIVE(Seven):
- Texas – 3.4%
- Utah – 3.2%
- Florida, Washington – 3.1%
- D.C., Idaho, Oregon – 2.7%
- California – 2.5%
BOTTOM FIVE(Seven):
- Mississippi, Kansas – 0.1%
- Wyoming – 0.2%
- Iowa, New York – 0.4%
- Arkansas – 0.5%
- Maine – 0.7%
The map below is provided courtesy of the Bureau of Economic Statistics, and breaks down each state by real GDP change from calendar year 2015-2016. Again, the strength is in the west, with healthy growth in the southeast. 2016 saw generally weak growth or even declining GDP in the plains states between the Mississippi River and the Rocky Mountains. The five states with the worst-performing GDP growth for 2016, North Dakota, Alaska, Wyoming, Oklahoma, and West Virginia are third, second, first, fourth, and sixth among all states, respectively, in terms of oil, gas, and other mining as a percentage of their state economies, according to work done by Lucy Dadayan and Donald Boyd at the Rockefeller Institute of Government. Among the top performing states, the largest contributor to growth in Washington and Utah was information services while the largest contributor to growth in Oregon was durable-goods manufacturing.
Biggest Movers – Annual State GDP % Change 2016
TOP FIVE(Nine):
- Washington – 3.7%
- Oregon – 3.3%
- Florida, Georgia, New Hampshire, Utah – 3.0%
- California – 2.9%
- D.C., Nevada – 2.4%
BOTTOM FIVE:
- North Dakota – -6.5%
- Alaska – -5.0%
- Wyoming – -3.6%
- Oklahoma – -2.3%
- West Virginia – 0.9%
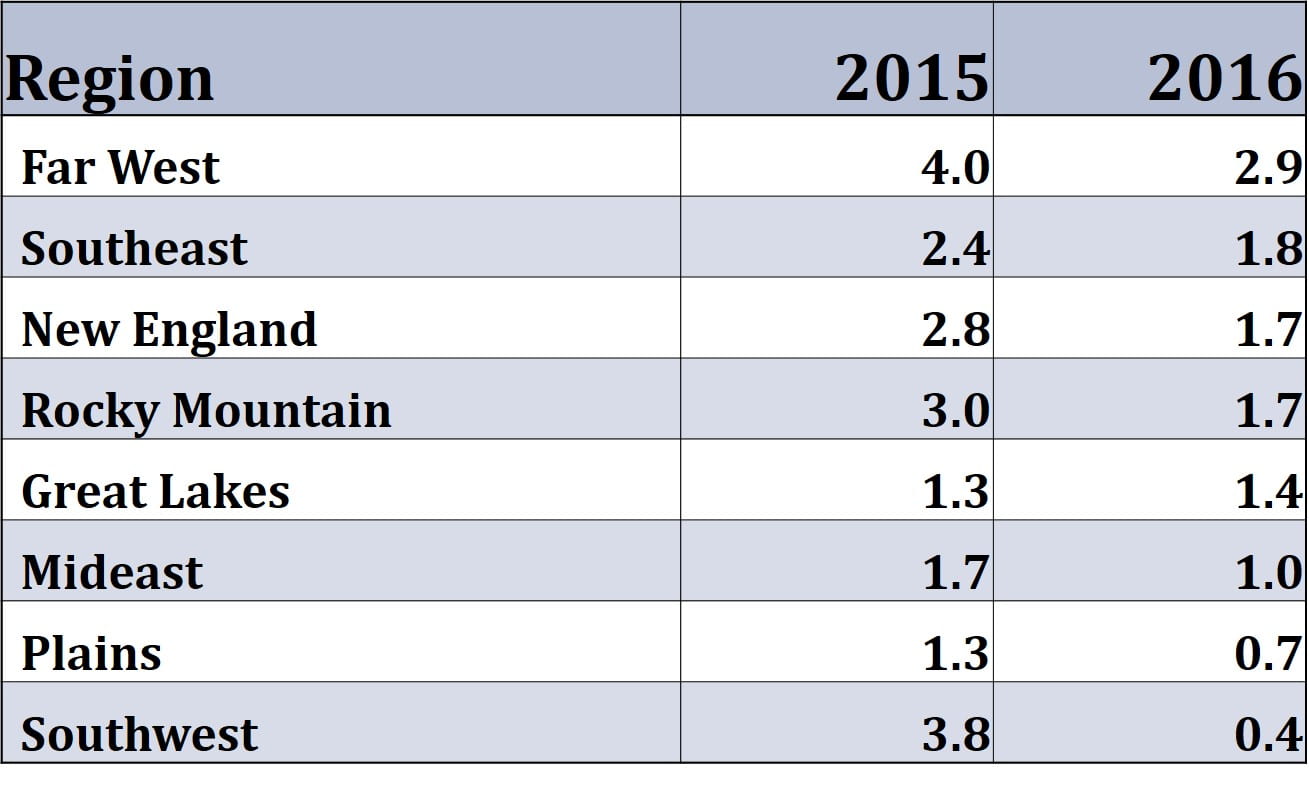
How Regions Rank
MuniNet ranked the eight regions categorized by the Bureau of Economic Analysis by GDP growth rate for the full calendar year 2016, and compared to the growth rates in 2015. What is most glaring is the slower growth rates generally in 2016; only the Great Lakes region grew at a faster pace in 2016 than 2015, and its increase was minimal. The biggest mover was the Southwest region, which consists of Arizona, New Mexico, Oklahoma, and Texas. Arizona actually saw its growth rate increase from 1.4% in 2015 to 2.1% in 2016. New Mexico’s growth rate fell from 1.7% to -0.5%, Oklahoma from 2.7% to -2.3%, and Texas from 4.5% to 0.4%.
Source: U.S. Bureau of Economic Analysis
Taking a deeper look at the data shows much going on underneath the surface of the overall national figures. Clear clusters of strong and weak performing states are revealed. Our state and local economies influence he we perceive the country is doing, in as much as GDP is a proper measurement of economic performance. Access to the full set of data provided by the BEA can be found here.
by Jeffrey L Garceau