New Data Show City Pension Plans’ Funding Ratios Improve, While Largest State and Local Pension Systems Assets Flat in 4th Quarter 2016
by Richard Ciccarone and Jeffrey L Garceau
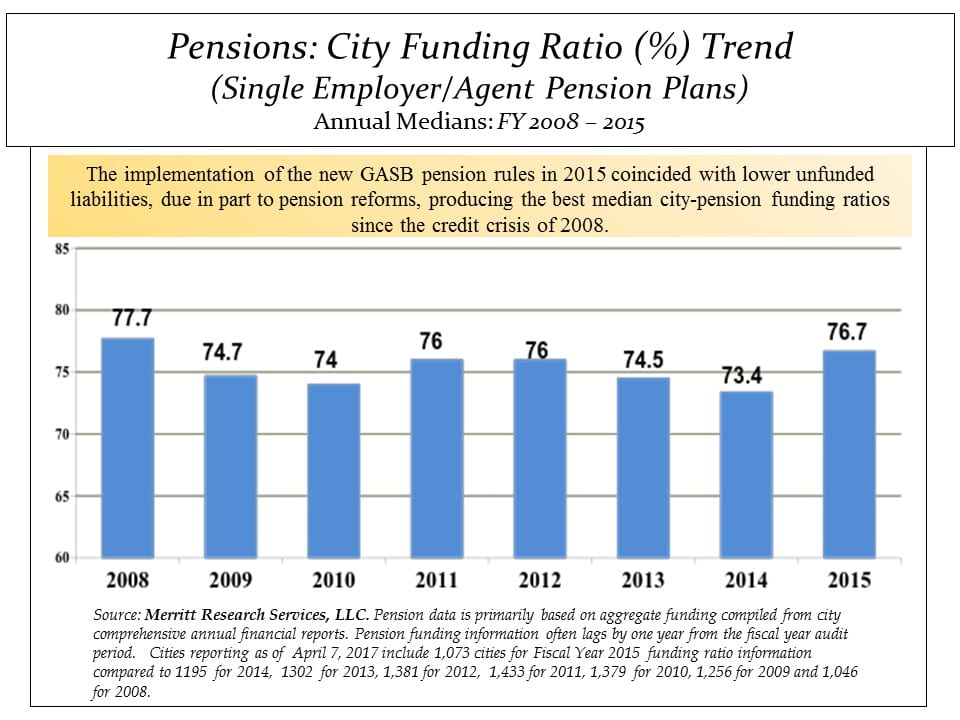
City pension plans improved their funding ratios in 2015, reaching the highest funding ratio since 2008. The success comes in part due to pension reforms, and occurred despite GASB pension rule changes. Funding ratios declined in 2013 and 2014, and one should be cautious to assume that there has been a shift in the overall trend. Returns have been expected to be lower for 2016 than 2015, and recent survey data from the U.S. Census Bureau partially bears that out.
MuniNet’s Richard Ciccarone on improved city pension plans:
- City Single Employer/Agent Pension Plans Improved in 2015, despite the implementation of GASB Funding Changes. Overall median unfunded pension liabilities, now called net pension liabilities, declined. Part of the reason for reduced liabilities was related to the impact of various recent pension plan reforms.
- The 2015 median funding ratio for city single employer/agent pension plans rose to 76.6% from 73.4% in the previous year. The data compiled by Merritt Research Services, LLC applied to 1,073 cities in 2015.
- Below 70% funding has been considered a warning zone, while well funded pension plans are expected to have funded at least 90% of their liabilities.
- Returns applying to Fiscal Year 2016 are expected to be more muted, due to less favorable investment returns and lowered discount rates. Optimistic discount rates (the median rate is 7.5%) still remain a major concern that could pose downside funding risk for many cities.
- Among the best large-cities with the highest single-employer or agent plan pension-funding ratios are Fresno, CA, Oklahoma City, OK and Garland, TX.
- On the negative side, Chicago, IL stands out among big cities, with an aggregate funding ratio of 23% for its single/agent plans in 2015.
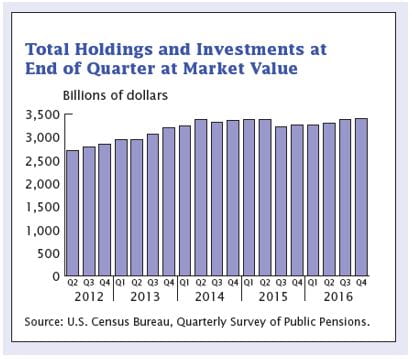 As the chart at right shows, after decent growth in Q1-Q3 in 2016, asset returns were nearly flat (up 0.4%) in the fourth quarter of 2016. The data for this chart comes from the U.S. Census Survey of Public Pensions, which focuses on the 100 largest public pension systems (cities and states) in the U.S. Therefore, it should be noted that what is being shown in the chart at right is not an apples-to-apples comparison of the chart from Merritt above. However, many of the largest U.S. cities are represented in both charts. Year-over-year, assets increased from Q4 2015 to Q4 2016 by 4.2%. While this sort of growth outpaces inflation, it does not keep up with the 7-8% range most pension systems use as their assumed discount rate.
More reform and investment is necessary to fix America’s public pension funding issues. MuniNet readers can find many valuable resources and insights on our Public Pensions page. Those who want to know more about discount rates should read Richard Ciccarone’s This May Be One “Discount” That’s not So Appealing. Great information on what can and should be done can be read in MuniNet’s James Spiotto’s The Pension and OPEBs Crisis – The Hard Facts and Possible Solutions – The Current State of the Underfunding of Pensions and OPEBs, and Can Unaffordable Pension Benefits Be Rolled Back, Reduced or Changed?