State and Local Government Tax Revenues Increase in Three of Four Major Tax Categories in Q4 2016
The U.S. Census Bureau has released their summary of changes in state and local government tax revenues in the fourth quarter of 2016. Overall, revenues increased by 2.5% for the quarter, from $391.6 billion in Q4 2015 to last year’s fourth quarter figure of $401.3 billion in total tax revenue. This outpaces the national inflation rate for the quarter of 1.8%, showing real revenue growth. Four major tax categories are tracked by the Census Bureau: property taxes, personal income taxes, general sales taxes, and corporate net income taxes.
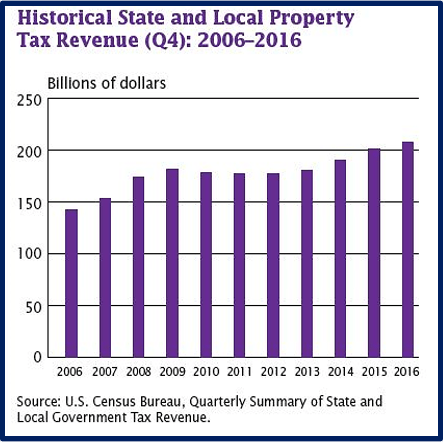
Of these four categories, property taxes performed best, increasing by 3.8%. Property taxes are the primary tax revenue stream of local governments, including special governments like school districts. Total property tax revenue increased from $200.6 billion in Q4 2015 to $208.3 billion in Q4 2016. 97.8% of property taxes, $200.6 billion in total, were collected by local governments. The chart above shows the year-over-year changes in property tax revenues going back to 2006.
General sales taxes were up 2.1% from Q4 2015, increasing from $90.8 billion to $92.8 billion. Individual income tax revenues increased only 0.3%, from $89.3 billion to $89.5 billion. Corporate net income tax collections were down year-over-year from Q4 2015 to Q4 2016, declining 1.9% from $10.9 billion to $10.7 billion.
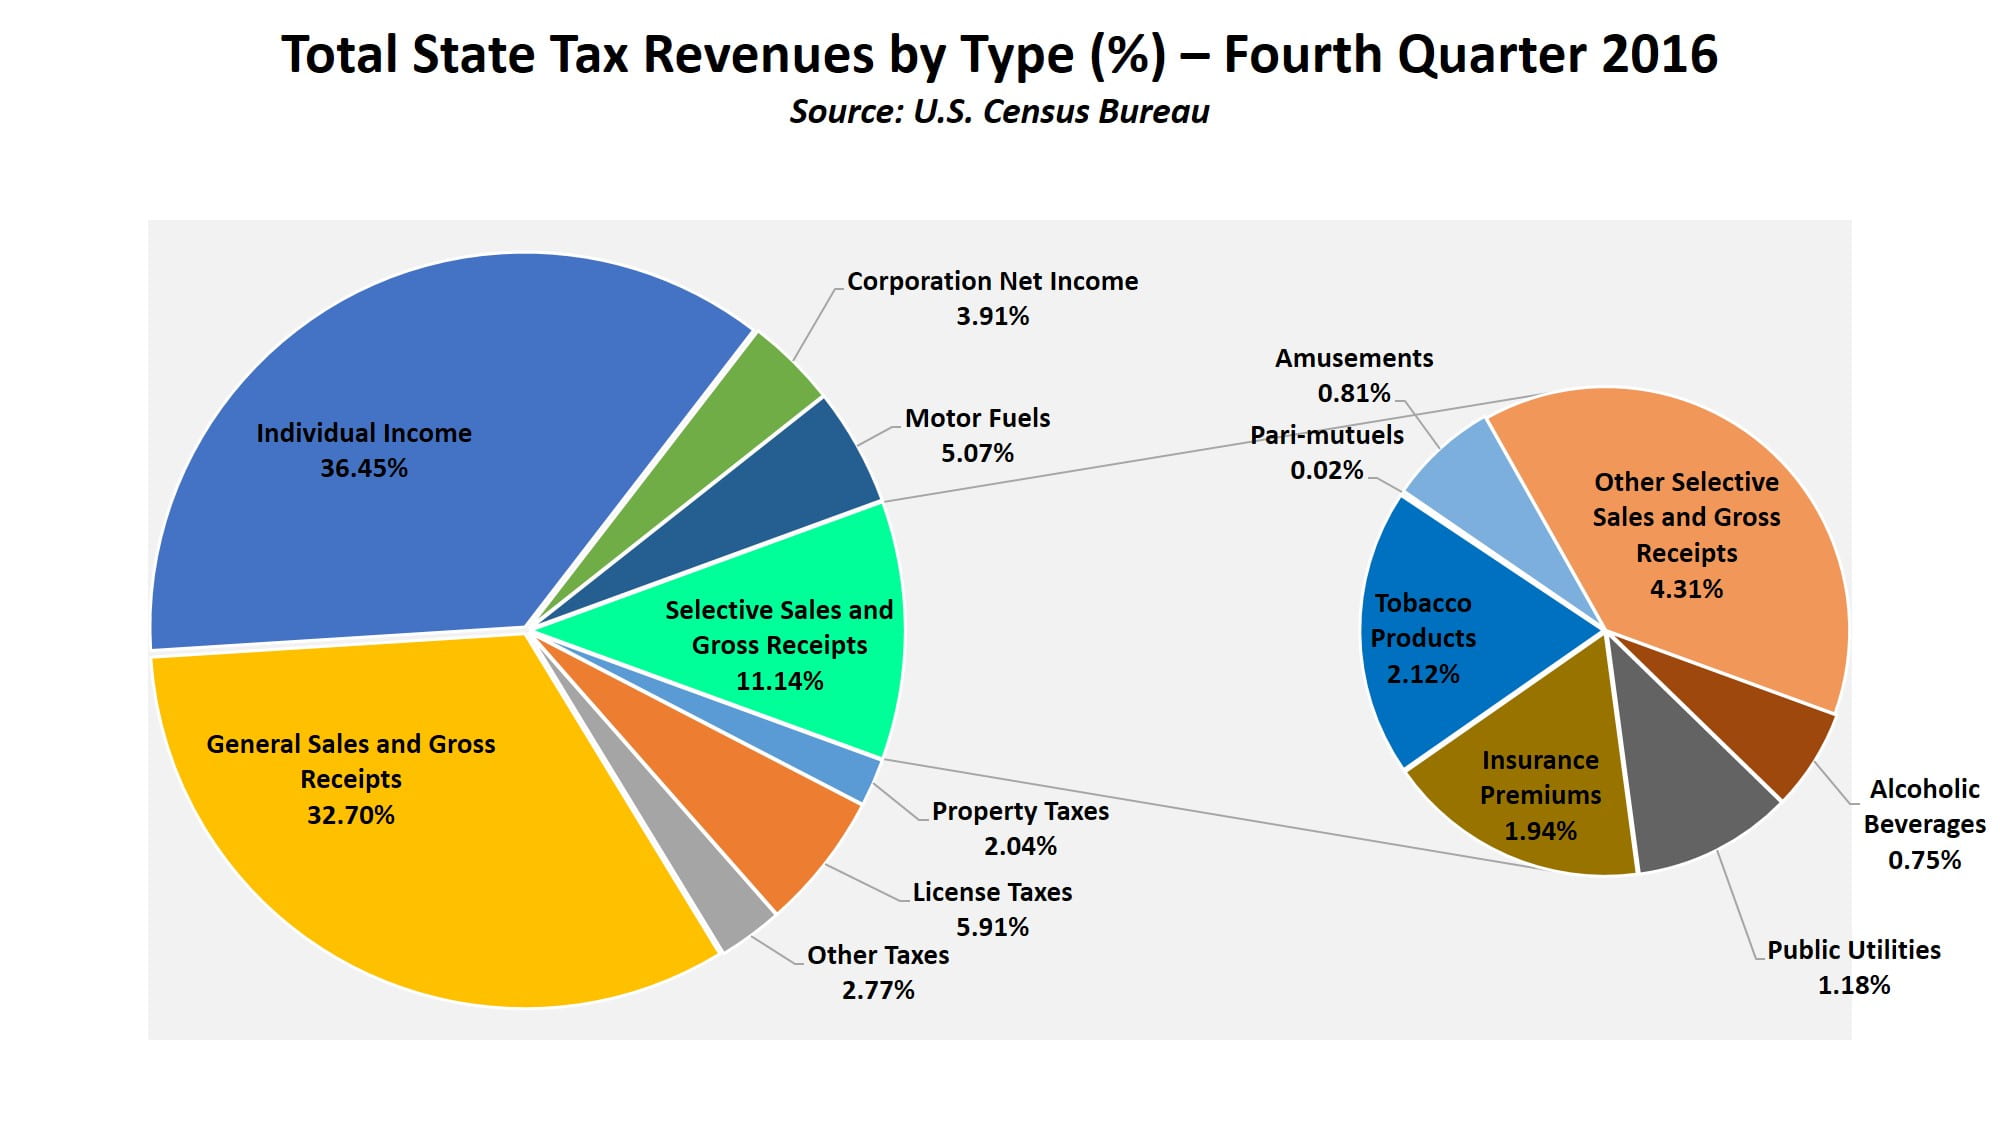
Focusing on states, most state tax revenue came individual income taxes and general sales taxes. These taxes made up 36.4% ($81.0 billion) and 32.7% ($72.7 billion) of total state tax revenues, respectively. The pie chart below, created by MuniNet Guide, breaks out the various tax types as percentages of overall state tax revenue. License taxes make up 6% of revenue, and motor fuel taxes 5%. Selective sales taxes make up the third-largest piece of the revenue pie after individual income and general sales taxes, encompassing 11% of all state tax revenue. We have broken the selective sales taxes out into a second pie chart on the right, showing the various types of these taxes as defined by the U.S. Census Bureau. Taxes on tobacco products make up the largest share of any single selective sales tax (2%). Pari-mutuels, which are gambling taxes on ‘pool’ betting or book-making forms of gambling, such as horse-racing tracks, make up only 0.02% of all state tax revenues.
Overall, state and local tax revenue increases, provided they are organic and not due to rate increases, reflect the general health of the economy, and ought to give municipal governments greater flexibility in fiscal management.
by Jeffrey L Garceau