Bureau of Labor Statistics New Interactive Unemployment Rate Chart Reminds Us of Just How Bad Things Were, and How Far We’ve Come
Building off MuniNet’s analysis of state employment numbers in 2016, the Bureau of Labor Statistics has released an interactive chart showing the evolution of state unemployment rate numbers, by month, from January 2007 to January 2017. The chart shows just how much the employment situation has improved overall since the worst days of the Great Recession. Certainly, some areas of the country are still economically suffering, and public and private debt remain troublingly high. However, a look at some snap shots in time show us the relatively strong position the U.S. job market is in. Please visit the BLS website to interact with the chart; below, we show snapshots from some key political points in time.
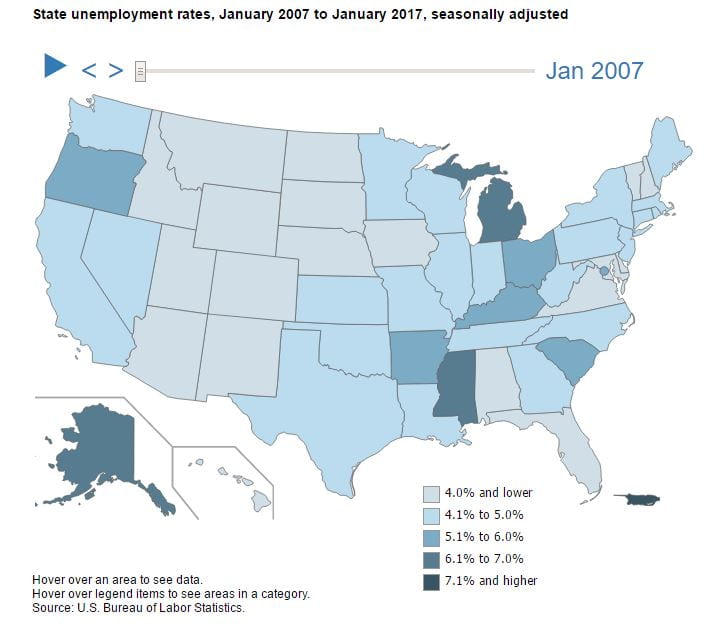
January 2007: Ten Years Ago
In January of 2007, only three states, Michigan, Mississippi, and Alaska, had unemployment rates above 6.0%. Michigan had the highest unemployment rate in the nation, at 7.0%.
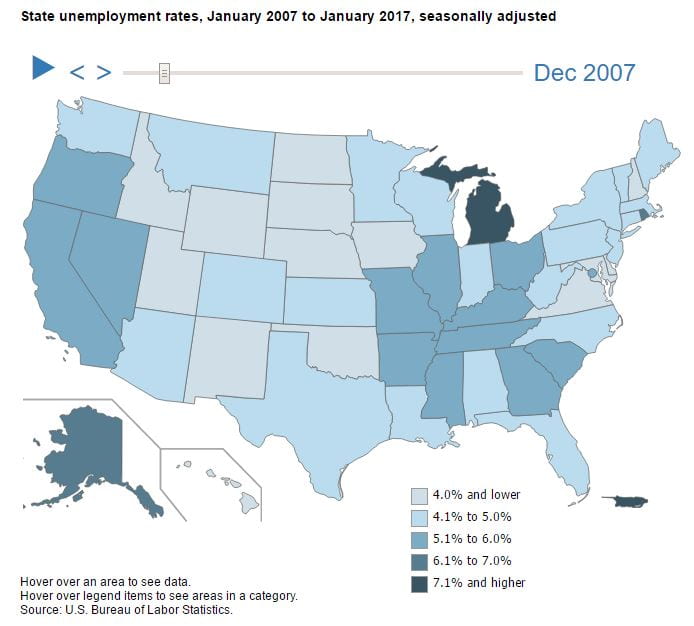
December 2007: The Official Start of the Great Recession
Economists set the official start of the Great Recession at December 2007. Michigan’s unemployment rate reached 7.3%, Alaska’s 6.4%, and California’s 6.0%. Several southern and mid-west states see their unemployment rates start to climb above 5.0%.
October 2008: Seminal Election
The chart below shows how things looked a month before the 2008 Presidential election. By this point, the country knew they were in remarkable economic times. Michigan continued to have the worst unemployment rate in the country, at 9.0%, but by this point, Oregon, California, and South Carolina all had unemployment rates above 8.0%. States in the Great Plains were relatively unaffected. North Dakota, South Dakota, Nebraska, and Utah all had unemployment rates below 4.0%.

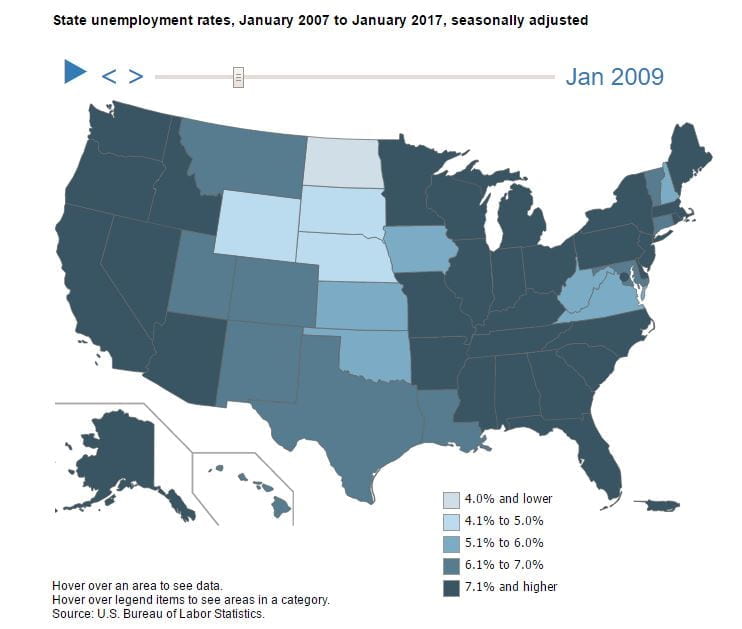
January 2009: A New President Takes the Helm
The extent to which things got worse just in the Presidential transition period is striking. Michigan’s unemployment rate grew to 11.2%. Whereas just four month prior, four states had unemployment rates above 8.0%, by January, 18 states had unemployment rates surpassing that threshold.
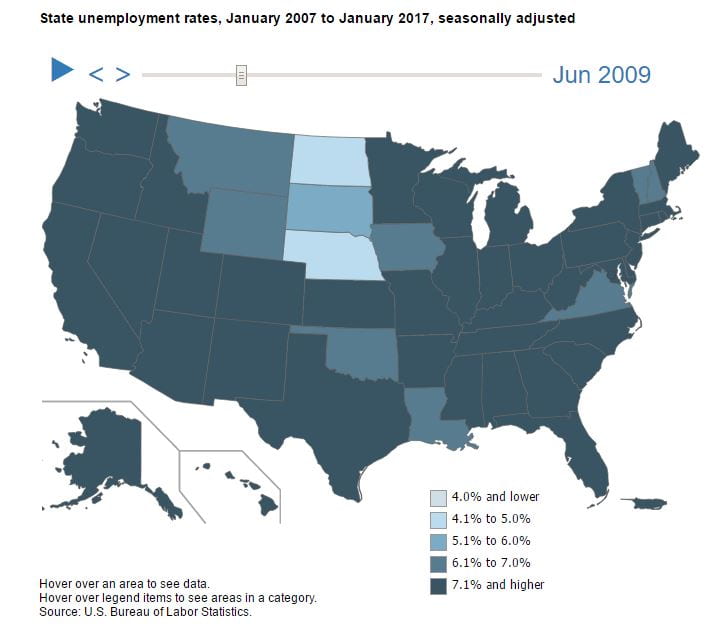
June 2009: The Recession Ends
The economy began growing again, albeit quite slowly, in June 2009. Although the employment situation would continue to decline, the U.S. economy has not dipped back into recession since. Michigan’s unemployment rate hit 14.9% by this time.
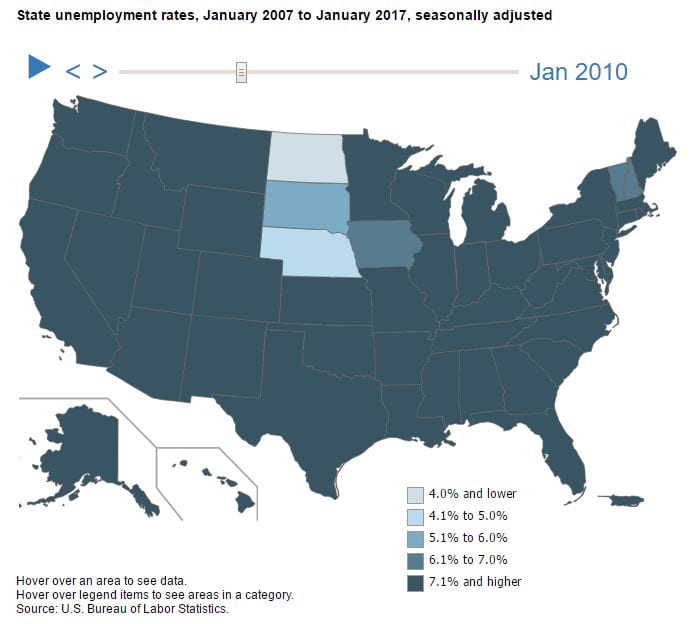
January 2010: Employment Bottoms out
Although the U.S. unemployment rate peaked at 10.0% in October 2009, this chart shows that high unemployment rates had become the most widespread among U.S. states one year into Barack Obama’s first term. Michigan continued to have the highest unemployment rate, at 13.7%. Only six states had unemployment rates under 7.0%; New Hampshire, Vermont, Iowa, Nebraska, North Dakota, and South Dakota.
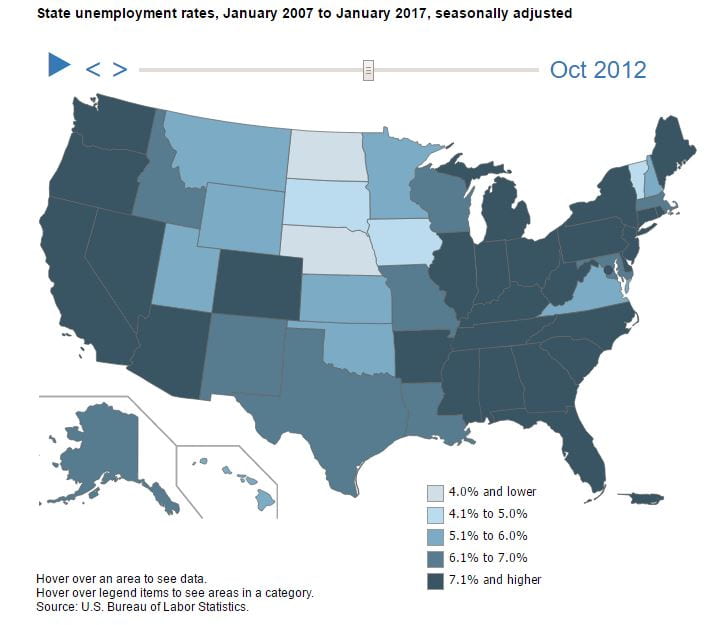
October 2012: Election Season Returns
A month before the 2012 Presidential election, the road to recovery remained long, but progress had been made. More than half of U.S. states, 27 altogether, still had unemployment rates above 7.0%. Michigan, in no small part with the help of the auto-bailouts, had recovered more quickly than many other states. Although Michigan still had a very poor unemployment rate of 9.0%, it had leap-frogged five other states, among which Rhode Island now had the highest unemployment rate in the nation, at 9.9%. North Dakota was back to pre-recession levels, with a nation-wide low unemployment rate of 3.1%.
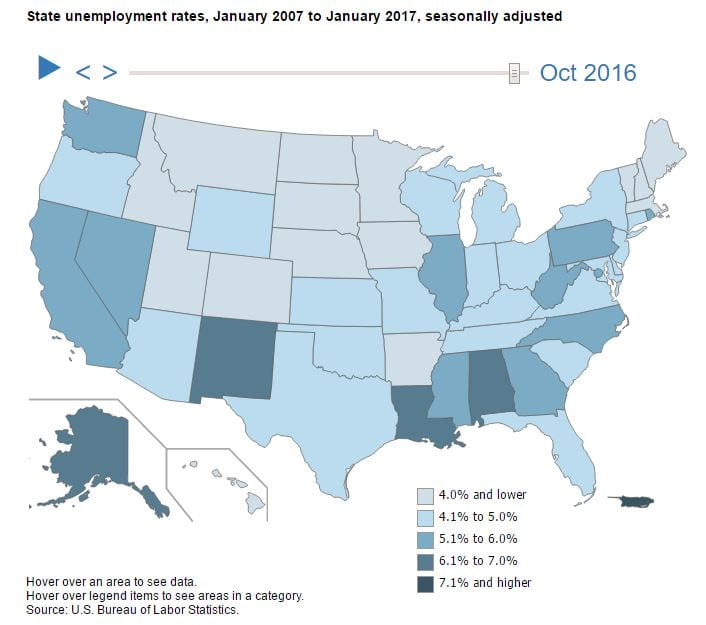
October 2016: About to Choose a New Path
As the Obama Administration’s days drew to a close, we see widespread recovery in employment figures. In the month before the 2016 Presidential election, New Mexico held the highest unemployment rate in the country, at 6.8%. Only four states had an unemployment rate above 6.0%, and New Hampshire had the lowest rate, of only 2.8%. The following month, the national rate would reach 4.6%, the lowest figure since August 2007.
January 2017: The Trump Era
What is true of NFL Quarterbacks and their team’s wins and losses also generally holds true for U.S. Presidents and the national economy: they get too much credit when things go well, and too much blame when things go poorly. That said, society often discusses the economy and employment situation in terms of Presidential administrations. Below is the state employment picture when President Trump took office in January of 2017. New Mexico maintained the highest state unemployment rate, of 6.7%, and New Hampshire maintained the lowest, at 2.7%. Colorado, Hawaii, and South Dakota all also had unemployment rates below 3.0%.

(Some of) The Rest of the Story:
‘Real’ Unemployment
No one metric determines how the economy is doing, and the economy does not solely dictate people’s quality of life. However, there are a couple of other metrics worth mentioning. Much is made of the ‘real’ unemployment figures. This is really a distinction between two metrics that are both measured and reported by the Bureau of Labor Statistics, the U-3 and the U-6 rate. The U-3 rate is the commonly reported rate, that we have been discussing throughout this article. Per BLS, people are counted as unemployed if they:
- Did not work for pay during the week that included the 12th
- Had actively looked for work during the preceding 4 weeks or were waiting to be called back from a temporary layoff
- Could have started a job if they had received an offer.
The U-6 rate takes a broader look at people who have given up looking for work, but may want employment, and people who are part-time not by choice, but due to economic circumstances. By official BLS definition, the U-6 measure includes:
- Unemployed people from U-3
- People who are “marginally attached” to the labor force, that is those who are neither working nor looking for work but want and are available for a job and have looked for work sometime in the past 12 months
- People who work part time for economic reasons, who would have preferred full-time employment but were working part time because their hours had been cut back or because they could not find a full-time job.
Source: Gallup Organization
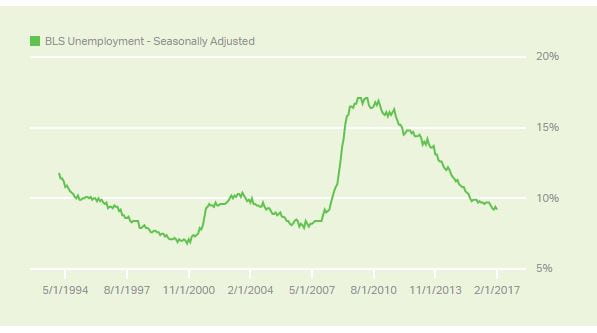
State figures for U-6 unemployment figures are publicly available, but must be collected together month by month. The national U-6 unemployment rate is sufficient to provide context. Per data collected by Gallup, U-6 reached a pre-recession low of 7.9% in December of 2006. It peaked at 17.1% in April of 2010, and as of January 2017, sat at 9.4%. While U-3 numbers have come back all the way to pre-recession figures, there is still a larger group of people who are more marginally attached to the work force or forced into part-time work than before. The recent history of the U-6 rate is provided in the chart above, via Gallup Organization.
Labor Force Participation

MuniNet recently discussed the 2016 figures for labor force participation in the states. As we stated then, the labor force participation rate the percentage of people aged 16 and up who are employed or actively seeking employment. Some people who are out of the labor force are so for reasons that are not necessarily detrimental. However, a higher labor force participation rate generally means a larger economic base, reflecting a more prosperous overall economy.
The chart at above, provided by the Bureau of Labor Statistics, shows the national labor force participation rate over the past decade. The labor force participation rate has declined every year in the past decade except 2016, which saw a modest increase. Ideally, we will continue to see this trend upward, although with the demographic bubble of the baby boomers retiring, it is unlikely to return to the highs of the late 1990s and early 2000s anytime soon.
This all serves to paint a picture that shows just how far we have come since the Great Recession. We have come far. Having good jobs available for people who want them is something we can all hope for the future.
by Jefferey L Garceau