MuniNet Breaks Down State Employment Figures for Year 2016 in Six Charts
The Bureau of Labor Statistics has released its annual report on employment and unemployment for regions and states in 2016. BLS includes unemployment rates and employment-population ratios for all 50 states, as well as the year-over-year changes of these metrics. In addition, the raw employment and labor force population figures are available to calculate the labor force participation rate of any and all states.
Overall, the employment data shows that 2016 was a positive year. Unemployment rates decreased in 38 states, and increased in only 9 states. Employment-population ratios increased in 36 states and decreased in 12, and 30 states saw an increase in their labor force participation rate, while 19 and the District of Columbia declined. These all reflect a net positive movement nationally. The national labor force participation rate increased for the first time year-over-year since 2006.
Bringing the focus back to individual states, MuniNet has taken a look at the top-10 and bottom-10 performing states in each of six measures: 2016 unemployment rate; change in annual unemployment rate; 2016 employment-population ratio; change in annual employment-population ratio; labor participation rate for 2016; and the annual change in the labor participation rate. Looking at the top-10 and bottom-10 states reveals the contrast between prosperous and struggling states.
Unemployment Rate
State unemployment rates range from New Mexico with a 6.7% unemployment rate, down to New Hampshire and South Dakota, which each have an unemployment rate of only 2.8%. To clarify, the unemployment rate is the percentage of people in the labor force who are unemployed. People are in the labor force if they are over 16 years old, and either are employed or have searched for work within the last four weeks, meaning they are actively seeking work. The general pattern this chart shows is that the best performing states have unemployment rates about 3% lower, or around half, of the worst performing states. No clear geographical pattern exists among the struggling states. It is noteworthy that three contiguous states, Nebraska and the Dakotas, are three of the five states with lowest unemployment rates.
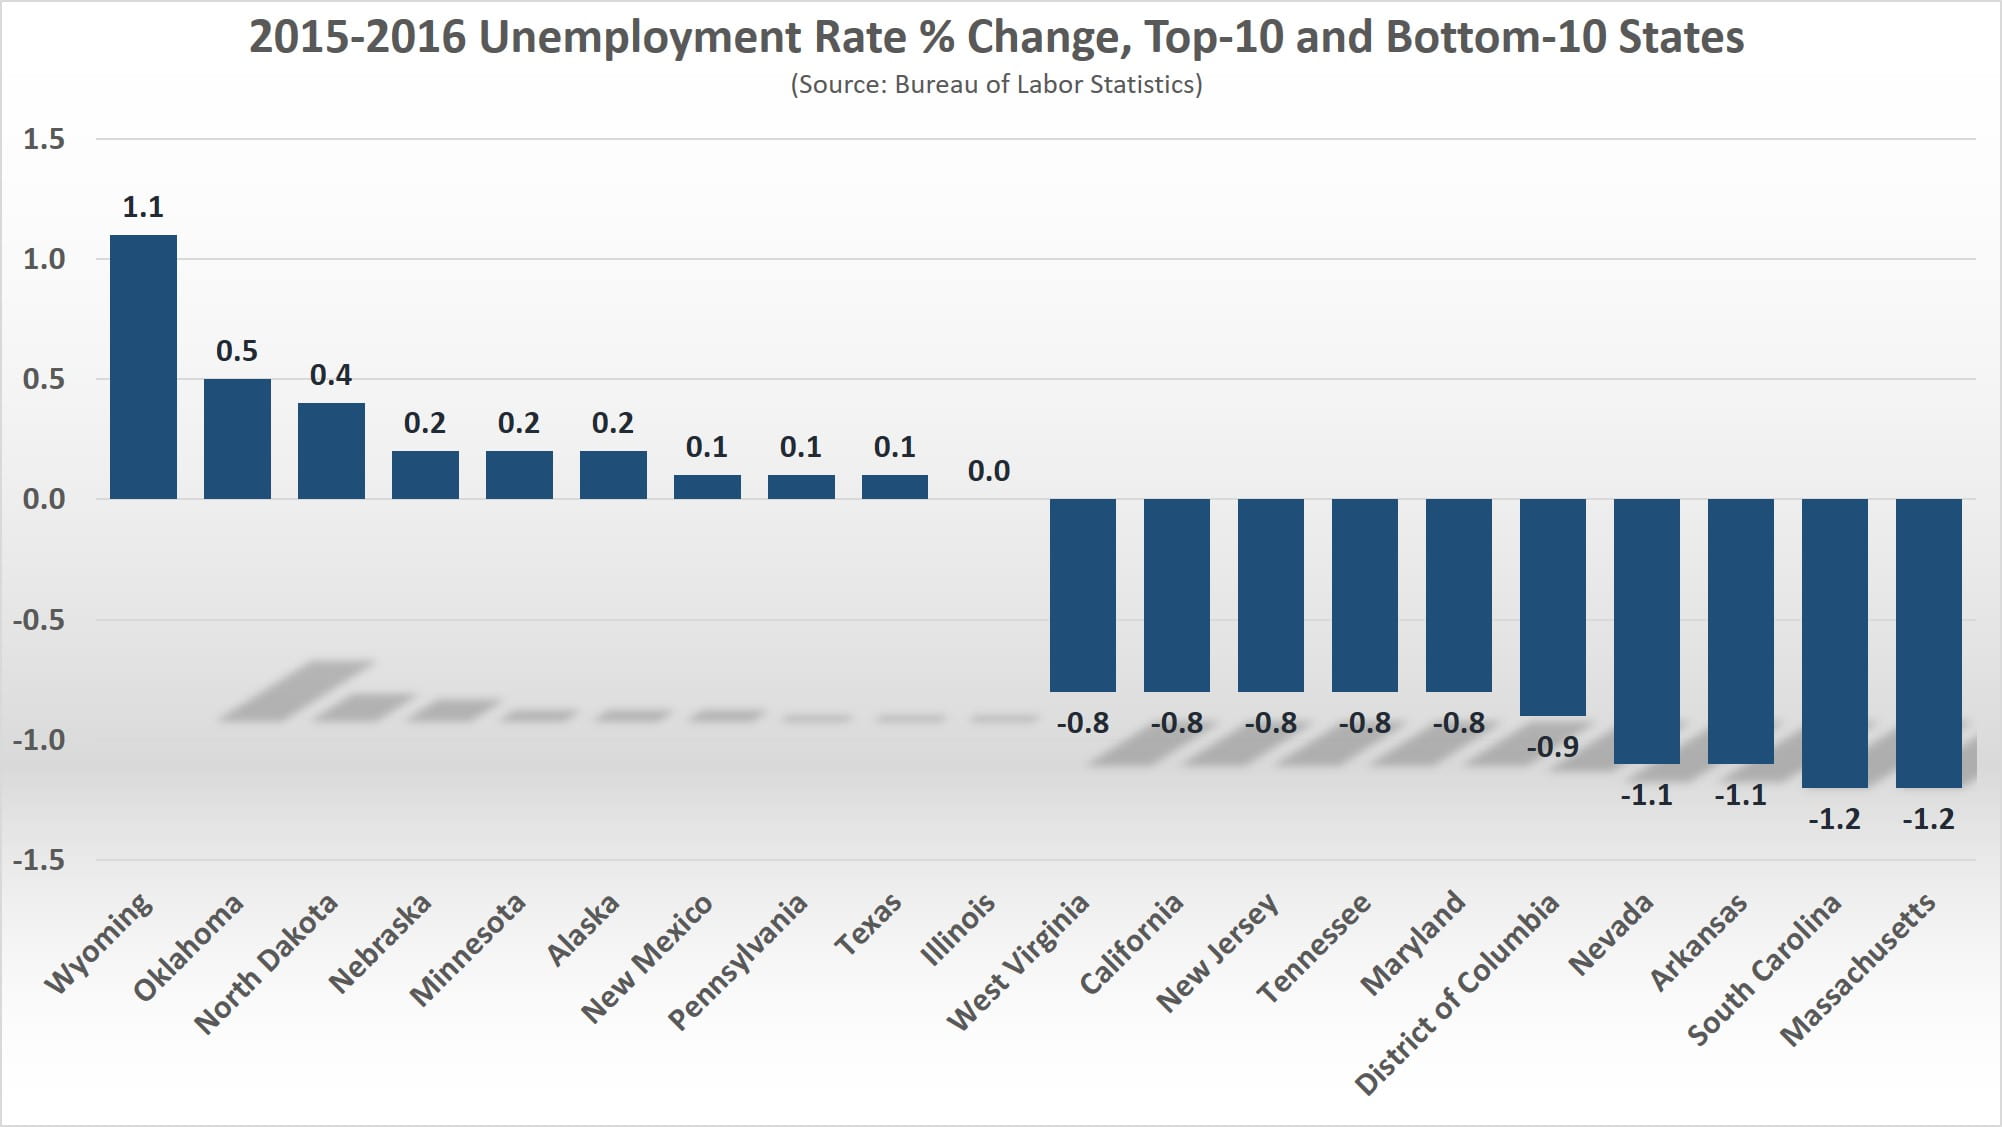
Looking at the percentage change in unemployment rates during 2016, the chart below shows that high-performing states collectively are improving at a faster rate than struggling states are declining. Only Wyoming, which saw its unemployment rate jump 1.1% during 2016, saw a significant increase of more than 0.5%. All top-10 states decreased their unemployment rate by more than 0.5%. States with low or high unemployment rates had mixed 2016 performances. West Virginia still has a 6.0% unemployment rate, but improved from 6.8% at the end of 2015. By contrast, North Dakota, with a still-low rate of 3.2%, had an even better unemployment rate of 2.8% in 2015.
Employment Population Ratio
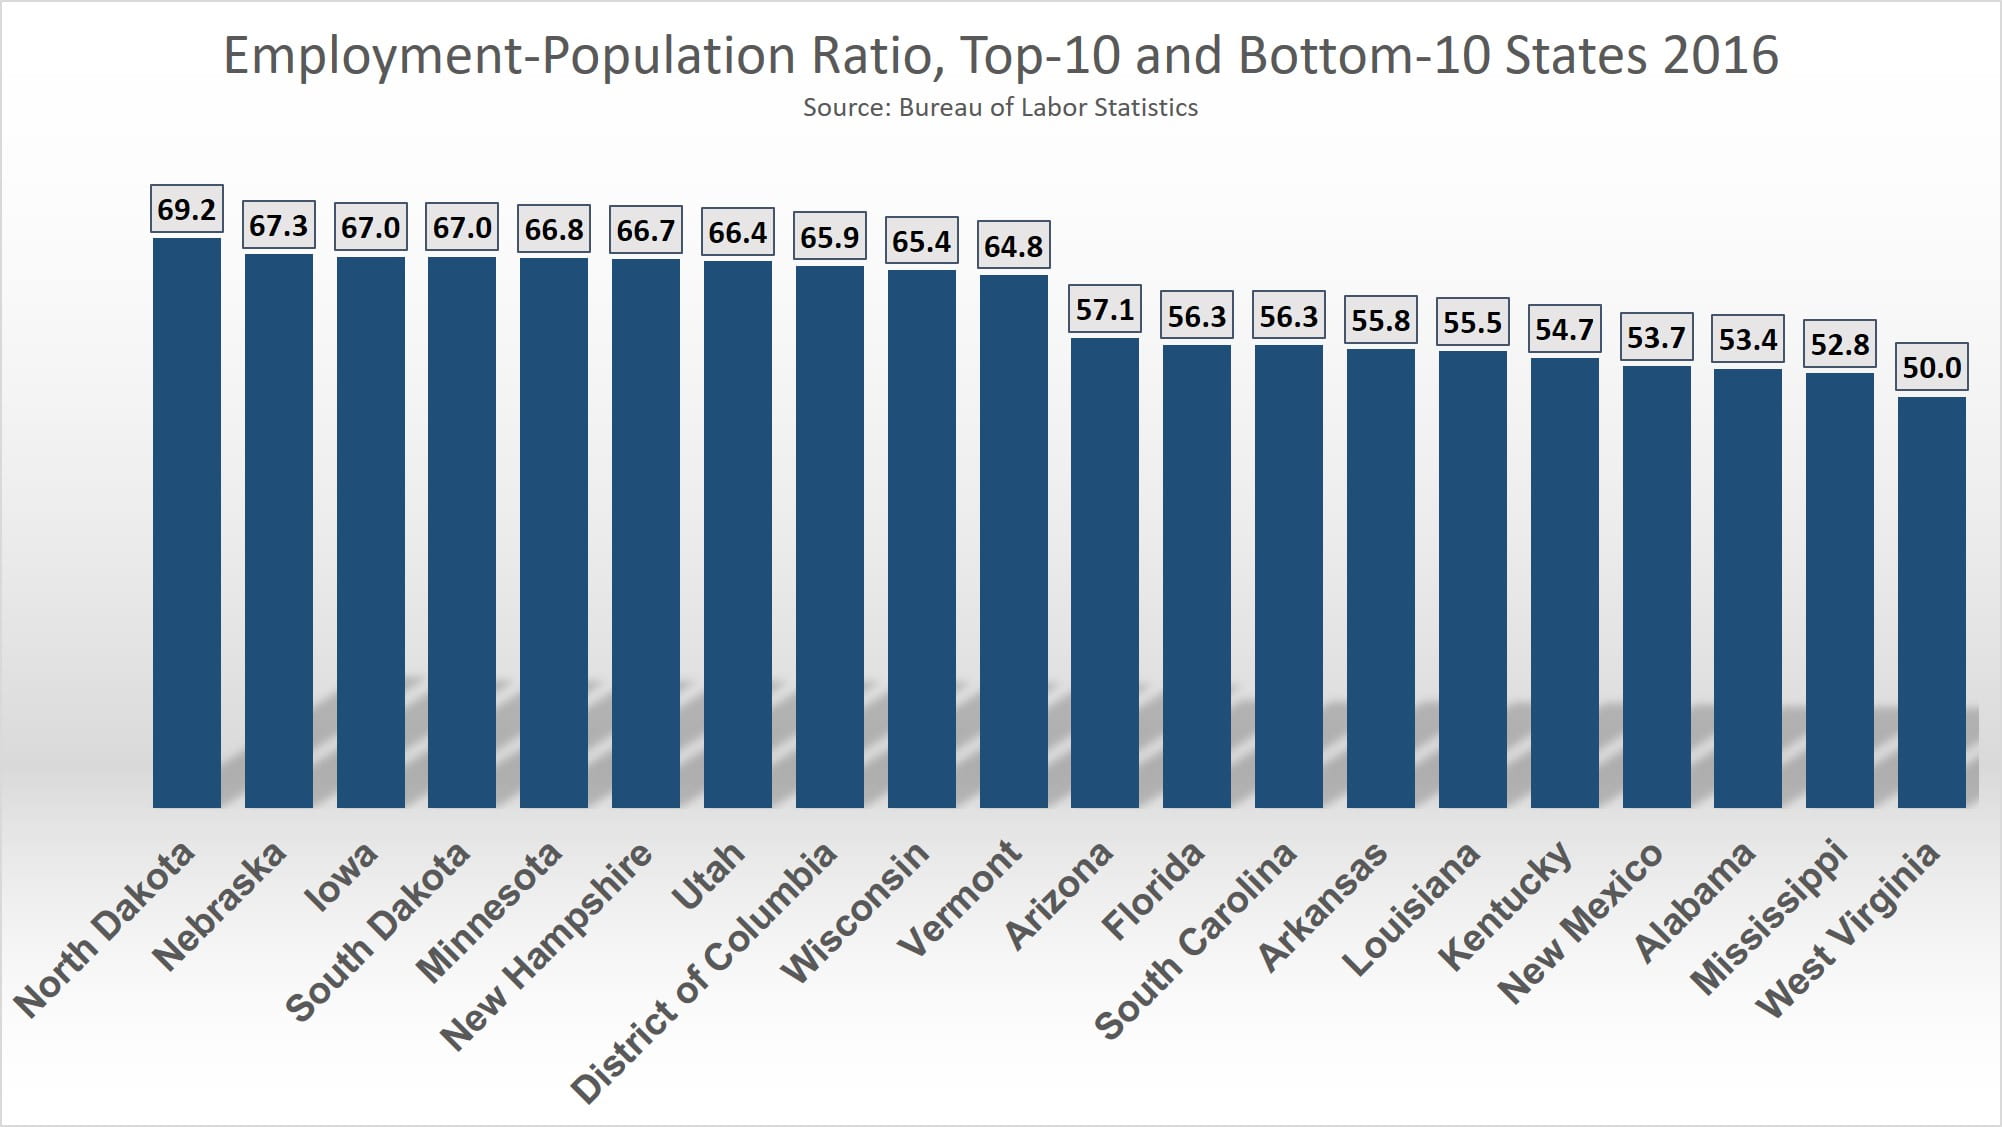
The employment-population ratio is simply the percentage of the population that is employed. The only caveat is that the population figure does not include the population under the age of 16. They are not included because of child labor laws, compulsory school attendance, and general custom. North Dakota has the highest employment-population ratio of 69.2%, and West Virginia has the lowest, with only 50% of the population employed. These figures include all the population 16 and over who are not actively in the labor force, hence why West Virginia is not considered to have a 50% unemployment rate. Five contiguous southern states, Florida, Alabama, Mississippi, Louisiana, and Arkansas, are all among the bottom-10 states in employment-population ratio. The top-five states are all contiguous; North Dakota, South Dakota, Nebraska, Iowa, and Minnesota.
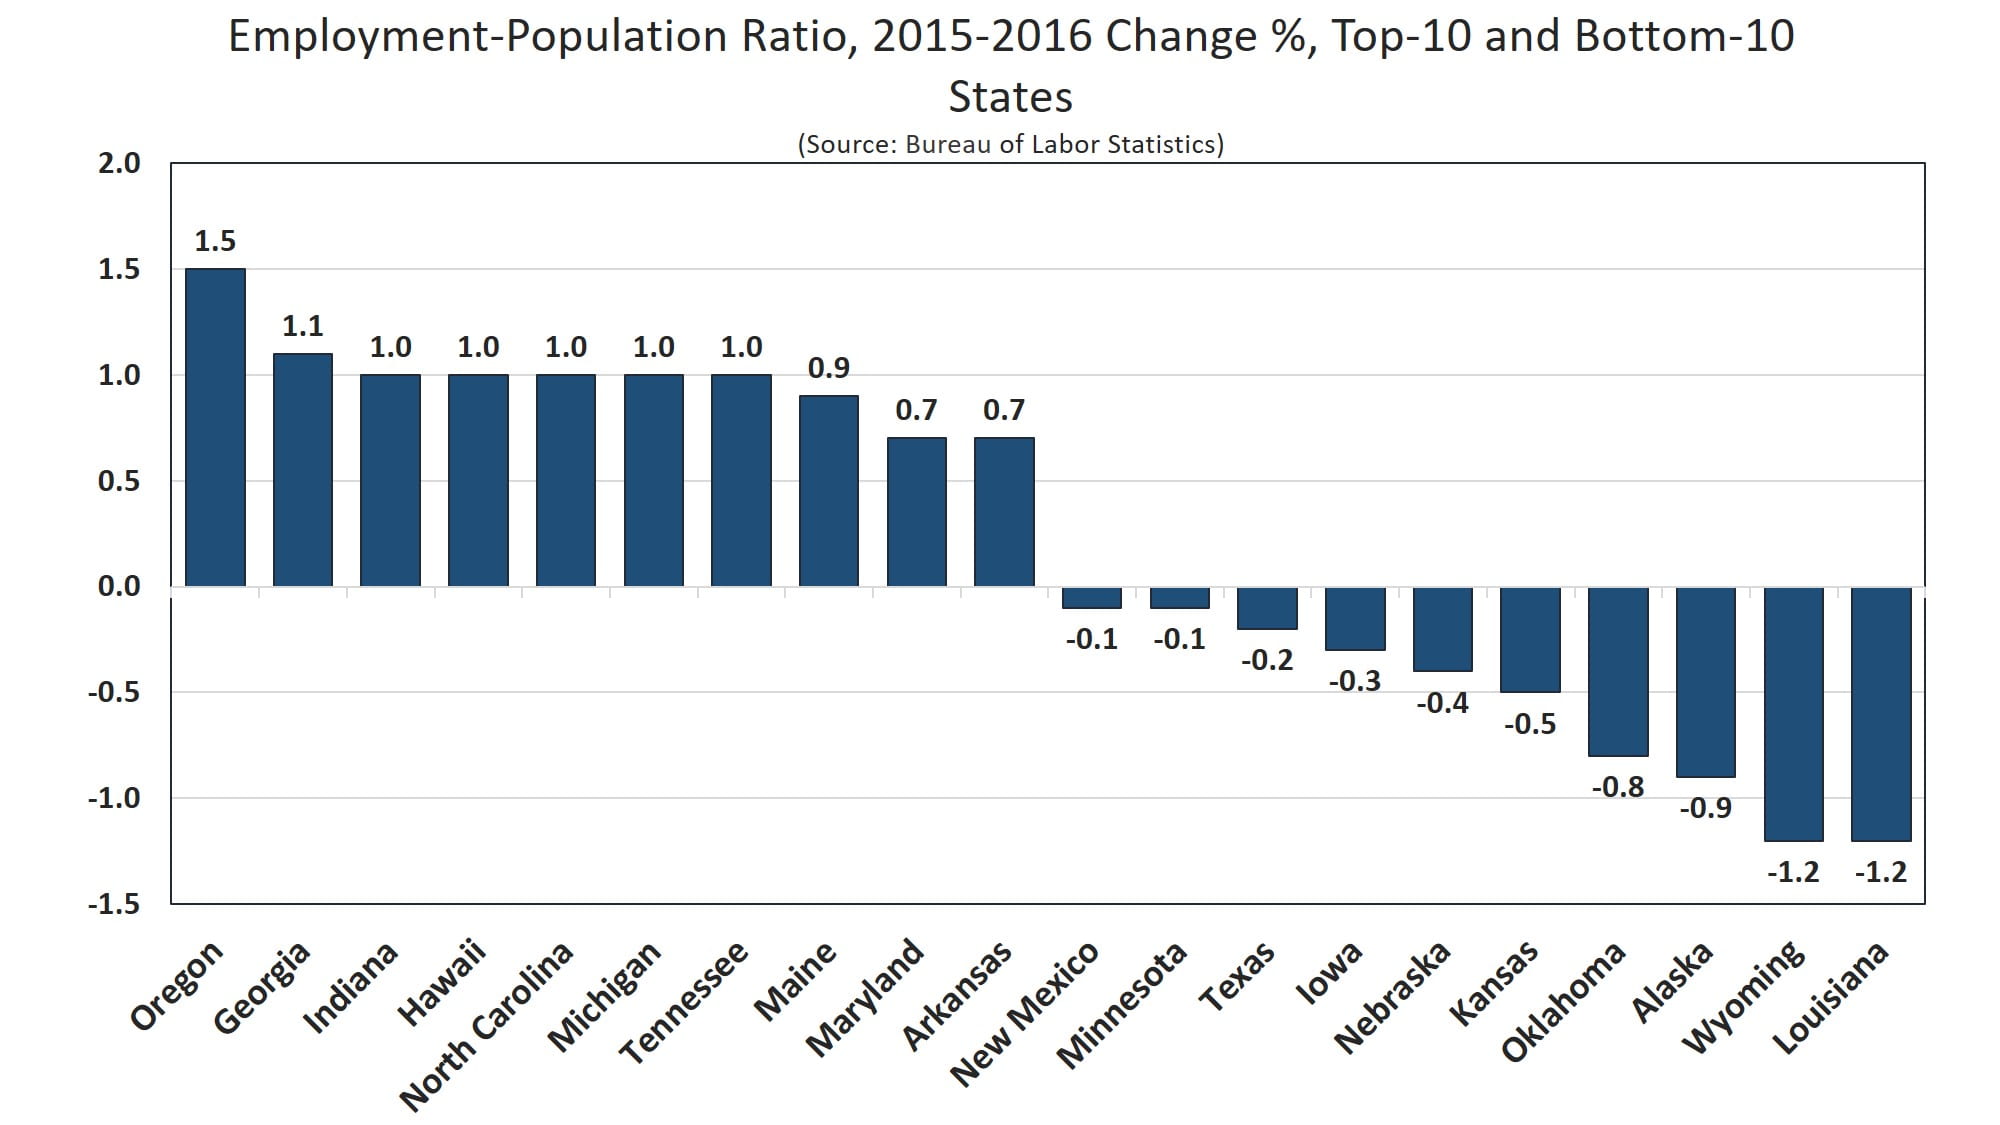
Employment-population ratio changes in 2016 ranged from an increase of 1.5% for Oregon, to a decrease of 1.2% for both Wyoming and Louisiana. Four contiguous states, Oklahoma, Kansas, Nebraska, and Iowa, are all among the bottom-seven performing states.
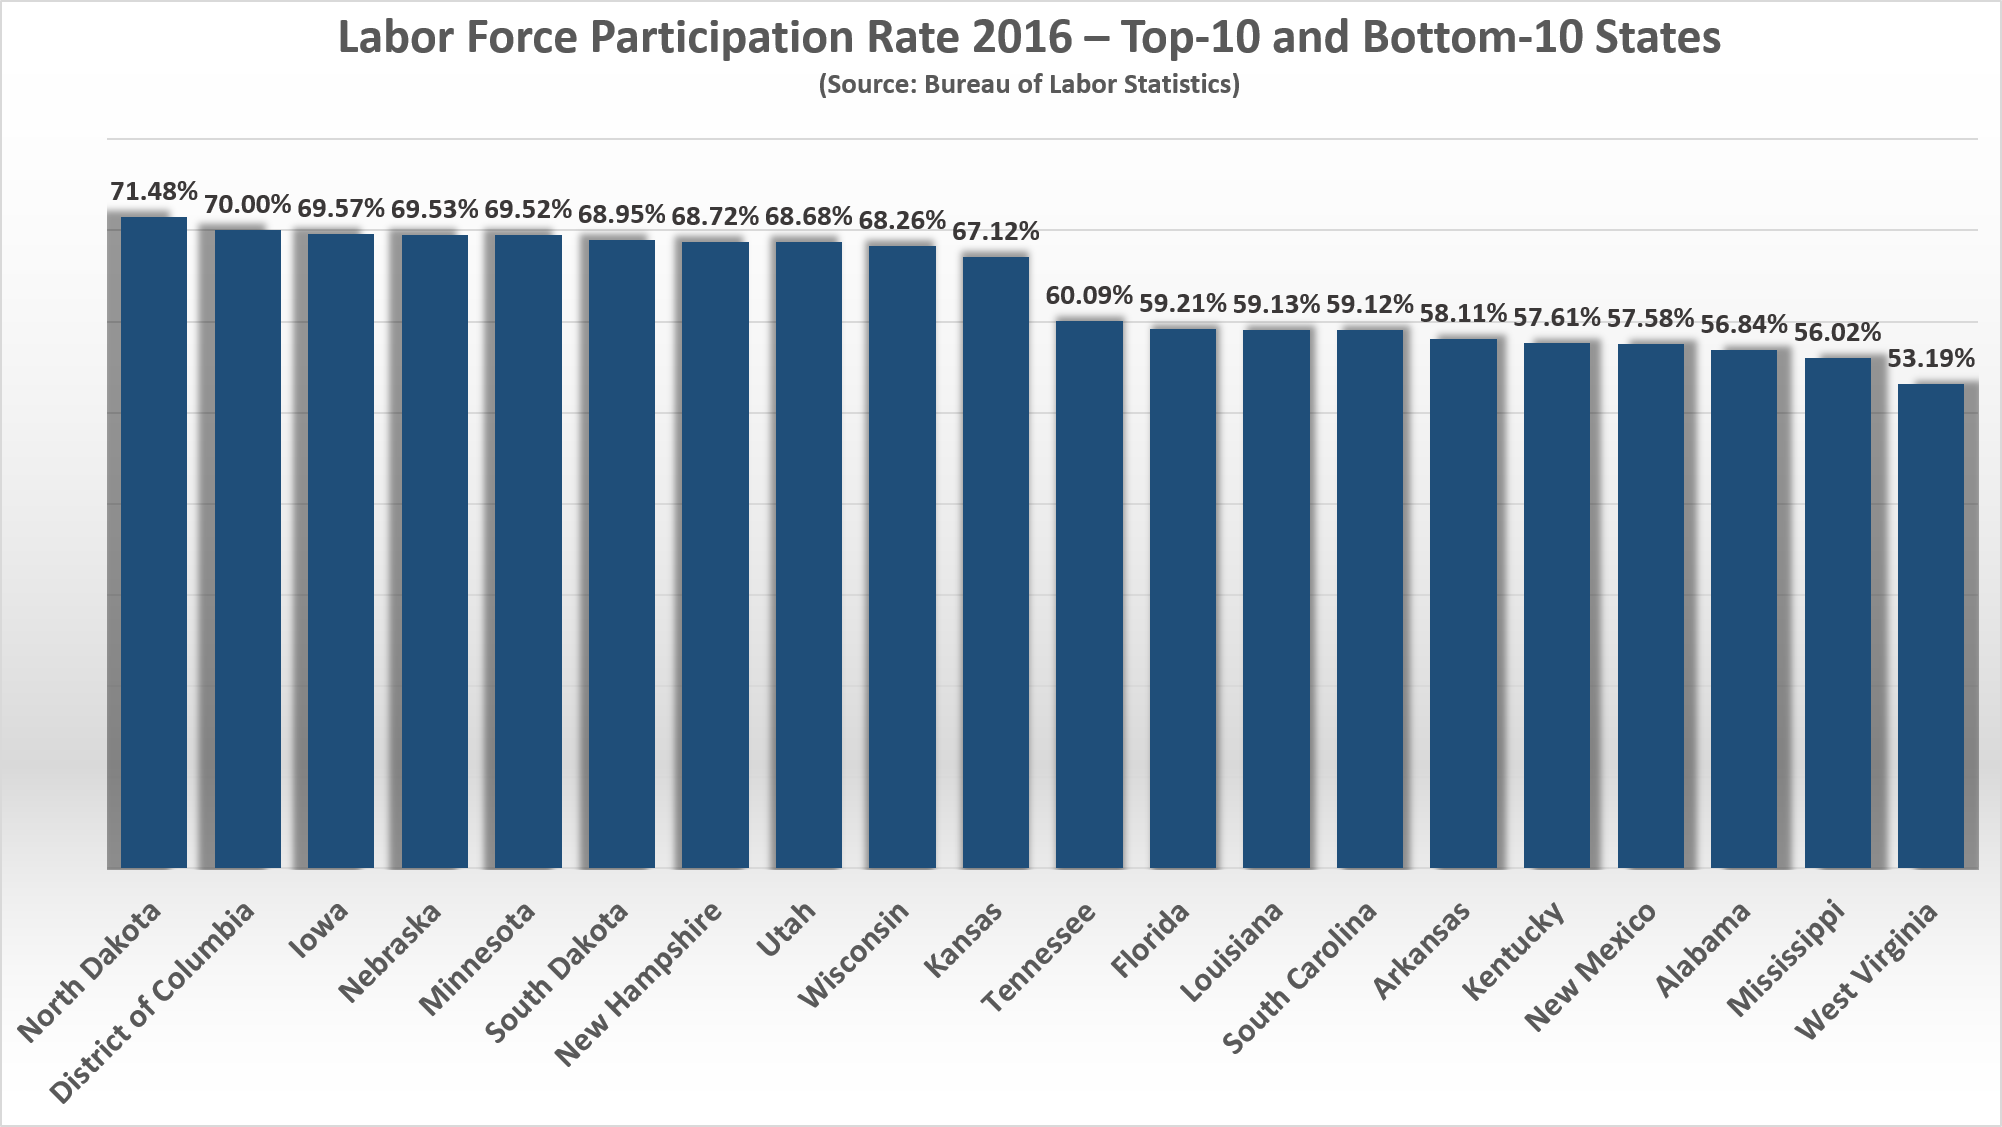
Labor Force Participation Rate
The labor force participation rate differs from the employment-population ratio, in that it shows the percentage of people aged 16 and up who are employed or actively seeking employment. Anyone who is not employed or has not actively sought employment within the past four weeks is considered outside the labor force. Some people who are out of the labor force are so for reasons that are not necessarily detrimental; this includes people who may be willingly retired or seeking higher education. However, a higher labor force participation rate generally means a larger economic base, reflecting a more prosperous overall economy. The national labor force participation rate was basically stable throughout the 1950s and 1960s, and trended upward for the next 30+ years, peaking in the late 1990s. It has since been in a decline since, and 2016 was the only the second year to see an increase over the year before since 2000.
The employment-population ratio is more volatile than the labor force participation rate, but they generally trend in the same direction. As such, many of the states with high or low employment-population ratios also have corresponding labor force participation rates. For the U.S. states and D.C., North Dakota has the highest labor force participation rate, of 71.48%, while West Virginia has the lowest, at only 53.19%.
It terms of labor force participation rate changes, we also see a strong correlation to the states with large gains and losses of employment-population ratio. Oregon improved by 1.19%, while Louisiana decreased by 1.4%.

As we can see, residents of some states, like the Dakotas, have a lot of reason to feel optimistic about jobs. In contrast, Wyoming, with not terrible static rates of labor force participation, employment-population, and unemployment, performed poorly in 2016. West Virginia, which actually had a good year in terms of unemployment rate decline, still has a high unemployment rate, and worryingly low employment-population and labor force participation rates. It is clear how people in different areas of the country have different feelings about jobs and the economy, despite undoubted overall improvement.
by Jeffrey L Garceau