Three Cities Show Three Images of Employment Picture Fortunes
The Bureau of Labor Statistics released its Metropolitan Statistical Area (MSA) unemployment figures for September 2016 earlier this month. Of the 387 official metro areas in the United States, 224 (58%) saw their unemployment rates drop lower than the previous year’s September 2015 rate, 141 (36%) saw a higher rate, and 22 (6%) metro areas had rates that were unchanged. The overall employment picture continues to be positive, but by digging into the details, we can find mixed performances and some of the reasons behind regional variances.
Yuma, Ariz., had the largest over-the-year unemployment rate decrease in September (-3.8 percentage points). Yuma also had the second highest unemployment rate of all metro areas in the nation, at 20.9 percent. The highest unemployment rate belongs to El Centro, Calif., with an unemployment rate 22.7 percent. The largest over-the-year rate increases occurred in Casper, Wyo. (+1.9 percentage points). The lowest unemployment rate was in Sioux Falls, S.D., 2.0 percent.
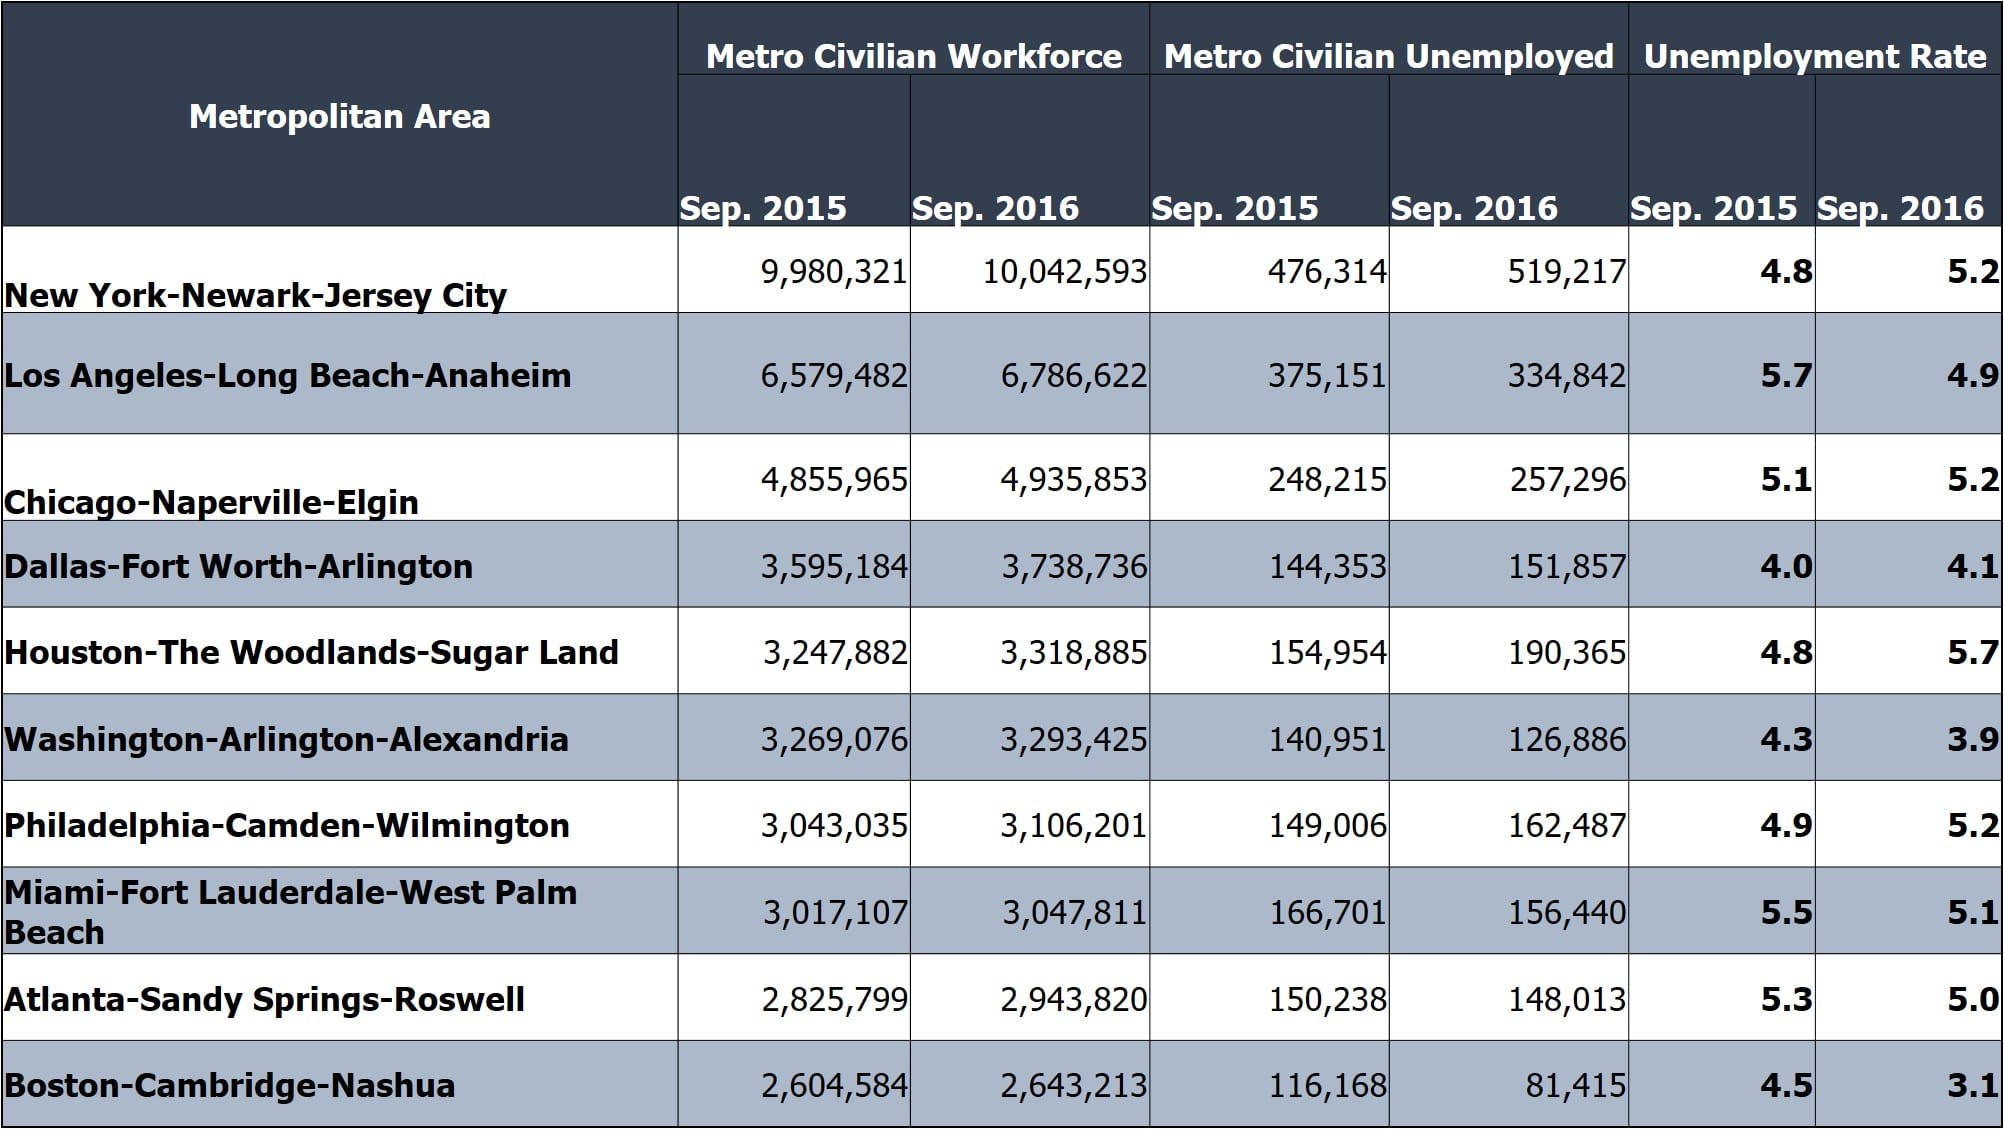
While the overall picture of national metropolitan employment numbers remains strong, there is a more mixed communication from the numbers regarding our largest metropolises. Half of the ten largest metropolitan areas saw their unemployment rates increase from September 2015 to 2016.
There are a lot of nuanced economic analysis that could be run to try to make sense of this. However, one general principle that could be at play is that unemployment rates may jump up and down a bit as they reach economic ‘full employment‘. The general idea is that, at any given time, there is some disconnect between the job openings available and the qualifications of job seekers in the market. There will always be some amount of workers actively looking for work.
Another possibility is that a higher percentage of people are looking for work. The commonly reported unemployment rate, called U-3, only includes in the workforce people working or actively looking for work. Even though five of the ten largest metro areas saw unemployment rate increase, all ten saw their workforce increase year-over-year. If these increases are more than just organic population growth, and actually include people who were out of the labor market returning because of increased opportunities, the pattern could be one of an upward trend in the workforce and the workforce participation rate. The unemployment rate would wiggle up and down as people enter or re-enter the workforce, increasing the unemployment rate while actively looking, and then finding jobs, bringing the rate back down. Over time, this would result in an expanded workforce and larger economic base.
However, it is possible there are less rose-colored reasons behind this. All of this could be tied to a general slowdown in the global and domestic economy. It is worth keeping an eye on.
A Tale of Three Cities
MuniNet Guide’s Employment Data page offers more government data on employment, unemployment, and workforce trends in all fifty states as well as all 387 official government metropolitan areas. We plot the last ten years of national, state, and metro unemployment rates on the same graph, as the examples below show. In our employment database, you can actually click on specific data points to get the specific number down to the month.
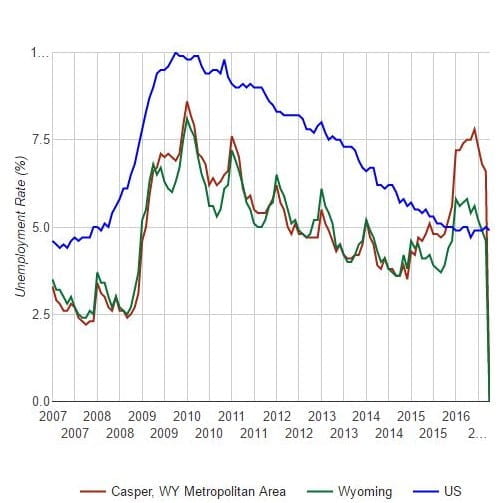
Casper, Wyoming
The first city we look at is Casper, Wyoming. It’s September 2016 unemployment rate of 6.6% is 1.8% higher than it was in September 2015. You can see that both Casper and Wyoming’s unemployment numbers have ran against the national trend over the past 18 months. An oft repeated topic when discussing state and local employment numbers on this site is an economic reliance on the energy sector, but it bears repeating. Wyoming’s economy is struggling due to what ae becoming long-term depressed energy prices, which make up an atypical proportion of its economy.
Yuma, Arizona
Yuma, Arizona is our next city. Yuma suffers from long-term elevated unemployment numbers, and experiences significant seasonal volatility, looking at how jagged their trend line is year to year. It’s current unemployment rate of 20.9% is 3.8% lower than same time last year. The seasonal shifts are due to the area’s reliance on agriculture and tourism. This can also contribute to the overall high unemployment, but another possibility is geography. Because of its proximity to the borders with California and Mexico, an inordinate number of Yuma residents may work across the borders, and others who have businesses in Yuma may live elsewhere, but keep a P.O. box in Yuma. When these situations occur in large percentages, it can distort the numbers reported through the Bureau of Labor Statistics standardized practices of data collection and calculation.

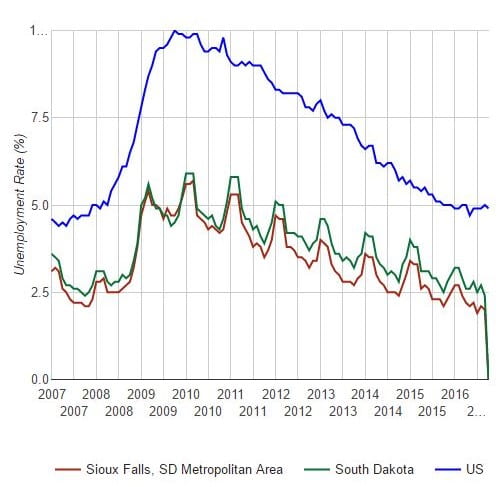
Sioux Falls, South Dakota
Our third and final city is Sioux Falls, South Dakota. Sioux Falls, and South Dakota in general, demonstrate consistently lower unemployment figures than the national average, but do follow the national trend. The current unemployment rate in Sioux Falls is 2.0%, which is 0.1% lower than one year ago. The economy of Sioux Falls boasts a thriving arts scene, as well as a diverse economy based on agriculture, tourism, construction, healthcare, and finance. Tourism in Sioux Falls and the Midwest/Great Plains region in which it resides is based in large part on outdoor sports and activities like hiking, fishing, hunting, and others. These activities are more all-season than warm-weather based tourism, providing a more stable economic base.
Don’t forget to visit MuniNet’s Employment Data page, as well as our Demographics page, for more useful information on U.S. cities and states.
by Jeffrey L Garceau