Part I of James Spiotto’s Series on Fiscal Distress Myths and Realities: Default Rate for State and Local Government Debt Has Been Relatively Low Especially When Compared to Corporate Debt Default
Myth: There is no difference between the default rate for state and local government debt compared to the corporate bond default rate
Reality: The default rate for rated state and local government bond debt is 1/50 or 1/100 (1 or 2%) of that of rated corporate bond defaults
History of Past Default Trends:
Historically, while political risk of non-payment was a possibility, it was a rare occurrence, if not in reality a non-existent concern, with a few exceptions (i.e. 8 states and one territory repudiated their debt between 1841 to 1843 with 7 of the 9 resuming payment by 1849, repudiation of Civil War related debt by 8 states in the late 1860’s, railroad bond and real estate defaults of the 1870s to 1890s and Washington Public Power Supply System, 1983). There are current situations that may test the long-term viability of the historical premise. Namely, it is hoped that Detroit, Stockton, San Bernardino and Jefferson County are rare aberrations rather than indicative of a growing trend.

Recent Default Rate:
Historically, there is a low default rate for bonds issued by municipalities and states and studies of recent default since 1970 continue the trend:
- The late Dr. John Petersen of George Mason University noted in his paper on “Municipal Defaults: Eighty Years Made a Big Difference” (2011) that, between 1970’s-2000’s, the municipal default for municipalities averaged per decade .10% to .24% (adjusted for WPPSS and Jefferson County, Alabama) not including the fact that over 80% of the defaults were conduit financings and not essential public financings. This is a far cry from the corporate bond default rate on average for investment grade and non-investment grade of about 10%. (Petersen, 2013).
- States have not defaulted on general obligations bonds since the late 1880’s, with the exception of Arkansas debt in 1933, which was thereafter refinanced.
- Historically, based on default rate, there is little support for the willingness to pay to be deemed a real problem since there is an absence of political risk.
- Essential service debt financing has historically enjoyed a significantly lower default rate than healthcare, housing and conduit state and local governmental financing.
- Unfunded pension obligations and deferred infrastructure costs are a more recent phenomenon – Prior to 1960s, most pension obligations were treated as gratuities and a significant number of big ticket infrastructure costs are only now starting to age such as the interstate highway system, electric grid, waste water treatment facilities, etc.
- We are closer to a tipping point and departure from the historical assurances than we have ever been. The difference may be whether there will be adherence to the Washington-Hamilton principle of honoring the payment of public debts and reinvesting in state and local government going forward.
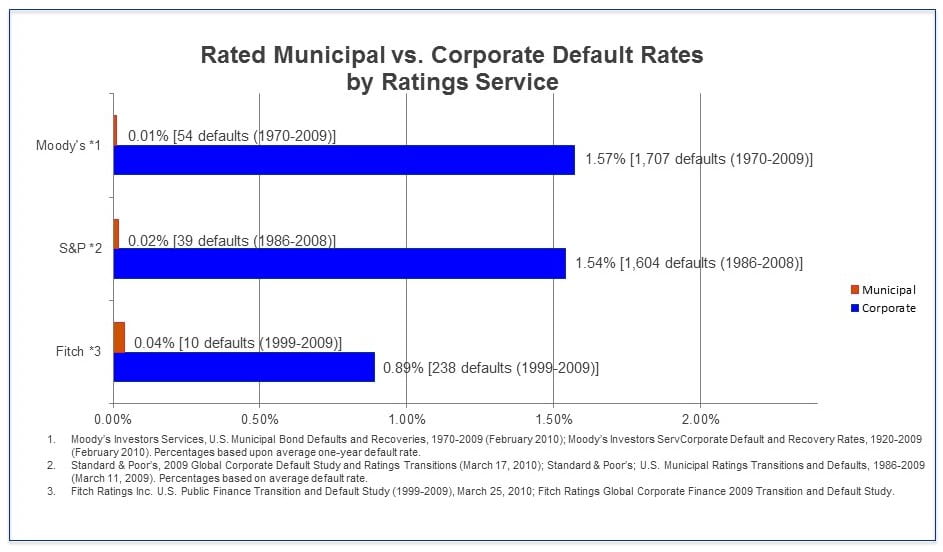
U.S. Municipal Defaults and Recovery 1970-2013:
Moody’s report on U.S. Municipal Defaults and Recovery 1970-2013 further supports a lower default rate and higher recovery than on corporate bonds and found:
- Municipal bond defaults for rated bonds remain extremely low namely 1.3 defaults per year on average between 1970-2007 period (0.01%) and 5 defaults per year from 2008-2013 period (7 in 2013 and 5 in 2012 with an average of 5 defaults) or 0.03%.
- The ultimate recovery rate remains higher than on corporate defaults with at least 60% recovery for the 1970-2013 period for municipal rated bonds versus 48% recovery for corporate senior unsecured rated bonds. Ranges vary by case – Jefferson County at least 80% for sewer bonds class, 100% of principal for G.O. warrants: Vallejo, Sierra King – 100% recovery for special revenues.
- Recently, monetary defaults on state and local government public debt ranged from 108 issuers for $1.95 billion in default in 2012 to 68 issuers for $8.57 billion in default in 2013 to 58 issuers for $9.02 billion in default in 2014. (Municipal Market Advisors). While there was a decline in the number of issuers in default by almost 50%, there was however the rise in dollar value of defaults in 2013 and 2014. This was due to Detroit’s filing for bankruptcy and defaulting and a large energy company bankruptcy. For example, $5.4 billion of the $9.02 billion in default in 2014 were the Detroit water and sewer bonds that ultimately were unimpaired in the plan of debt adjustment. In addition, TXU, a subsidiary of Energy Future Holdings Company, declared bankruptcy in April 2014, which filing caused the default on $1.16 billion of industrial development bonds.
Look out for future parts in this series on fiscal distress myths and realities
James E. Spiotto, Co-Publisher © James E. Spiotto. All rights reserved