2016 Sees State and Local Q2 Tax Revenues Decline 0.6% Since Same Time Last Year
State and local governments provide most of the public services that we benefit from on a daily basis. Your garbage gets picked up, your streets get plowed, your water turns on, your schools run. Part of the costs of government services is determined by how efficiently and intelligently government spends money, but that is a political debate for another time. What is true is that government cannot provide services without adequate funding. It needs to generate necessary revenues. The U.S. Census Bureau this week released their quarterly summary of state and local government tax revenue for the second quarter of 2016
Decreased Revenues
The four largest tax categories, property taxes, sales taxes, and corporate and individual income taxes, decreased a total -0.6% from Q2 2015 to Q2 2016, bringing in $338.2 billion in 2016, down from $340.4 billion in 2015. The graph below from the Census Bureau reflects the changes in each category as well as the total change.
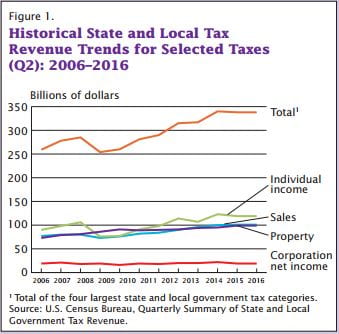
The largest growth category came from state and local property taxes, which increased 4.2% from Q2 2015 to Q2 2016, from $95.4 billion in 2015 to $99.4 billion in 2016, respectively. Property tax is the primary funding source for local governments. $95.2 billion of those revenues collected in Q2 2016 were for local governments, with only $0.2 billion going to state coffers.
State governments are primarily funded by tax revenues from individual income taxes and sales tax receipts. Individual income tax revenues decreased at a rate of 3.0%, from $122.9 billion in Q2 2015 to $119.3 billion in Q2 2016. Sales tax revenues also increased slightly, from $100.4 billion in Q2 2015 to $100.7 billion in Q2 2016, a rate of 0.3%. Corporate income tax revenues declined for the third consecutive quarter, with revenues down 12.8%, from $21.6 billion in Q2 2015 to $18.9 billion in Q2 2016.
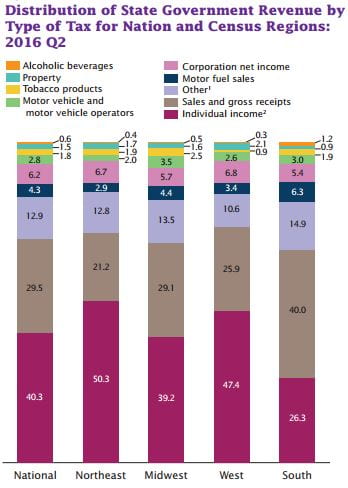
The Census Bureau has provided a very interesting chart showing the breakdown of state government Q2 tax revenues by tax type, for the nation overall as well as the four official Census Regions. Sales taxes and personal income taxes make up the two largest revenue generators for each region, but to varying degrees. For example, the Northeast states generated nearly twice as much revenue as a percentage of overall taxes from individual income taxes as the Southern states, but rely half as much on sales taxes as the South.
Source: U.S. Census Bureau
MuniNet took the Census Bureau’s Total State Tax Revenue for the second quarter of 2016, and the Bureau’s most recent state population estimates from July 2015, to calculate the total tax revenue per capita for each state, for the second quarter of 2016. Note that these figures only reflect taxes derived by the state government; local taxes and Federal taxes are not included, so these figures do not reflect total tax burden on citizens. However, the wide disparity in state taxes per capita is interesting.
Total Tax Revenue Per Capita

Total Taxes and Total Population provided by U.S. Census Bureau
Is it up to policy makers to ensure that these revenues are used prudently. The full data sets from the Census Bureau can be found here.
by Jeffrey L Garceau