Metropolitan GDP Numbers Show Strong Growth Widely Dispersed But Far From Universal Prosperity
Our state and local economies influence he we perceive the country is doing, in as much as GDP is a proper measurement of economic performance. People will find statistics about the national economy largely irrelevant if the community around them is significantly more or less prosperous than the country as a whole. Therefore, understanding how specific regions, states, and local areas are doing can tell voters and policy makers a lot about how current systems are working, and where further efforts are needed.
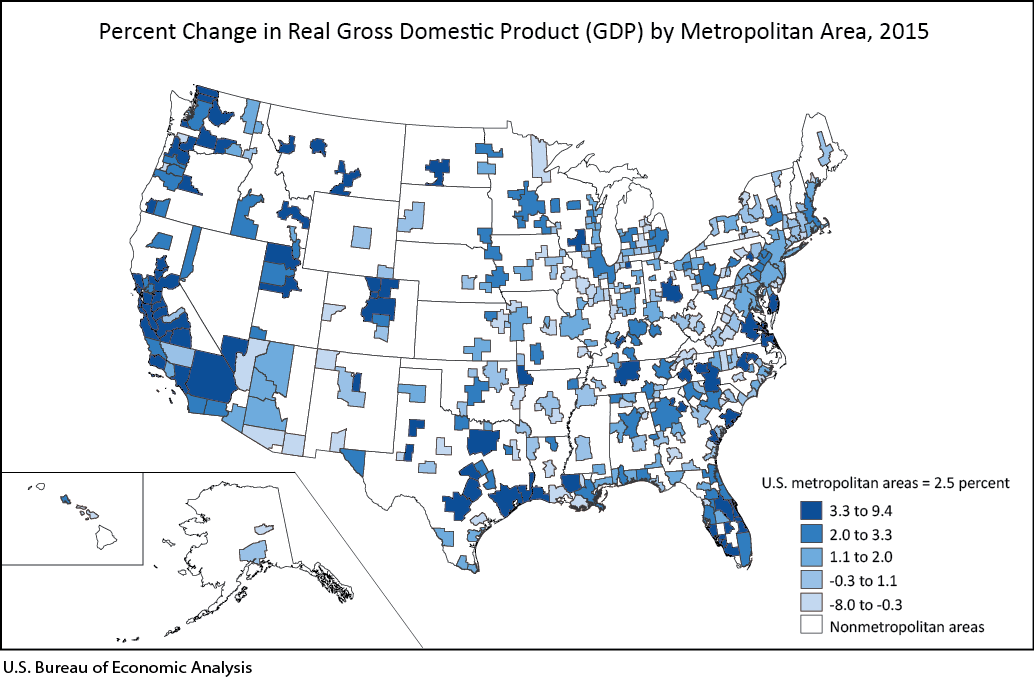
Today, the Bureau of Economic Analysis released their figures for metropolitan GDP changes for the year of 2015. Overall, the collective Gross Domestic Product changes in all U.S. metropolitan areas was an increase of 2.5%, up from 2.3% in 2014. These figures differ from the numbers for the U.S. overall, for which the GDP increased 2.6% in 2015, and 2.4% in 2014. In total, 292 of the 382 official metropolitan areas (76%) saw GDP growth in 2015.
BIGGEST MOVERS – STATE GDP 4TH QUARTER 2015
- Of the large metropolitan areas, those with population greater than two million, San Antonio-New Braunfels, TX (5.9 percent) and Austin-Round Rock, TX (5.0 percent) were the fastest growing large metropolitan areas.
- The slowest growing large metropolitan areas were Washington-Arlington-Alexandria, DC-VA-MD-WV (1.3 percent) and Cleveland-Elyria, OH (1.1 percent).
Here is a list of the top ten and bottom ten performing metro areas overall.
TOP TEN:
- Midland, TX 9.4%
- San Jose-Sunnyvale-Santa Clara, CA 8.9%
- Lake Charles, LA 8.3%
- Visalia-Porterville, CA 7.6%
- Provo-Orem, UT 7.6%
- Santa Rosa, CA 7.2%
- Raleigh, NC 7.0%
- Bend-Redmond, OR 6.9%
- Beaumont-Port Arthur, TX 6.1%
- Billings, MT 6.0%
BOTTOM TEN:
- Johnstown, PA -3.1%
- Decatur, IL -3.1%
- Decatur, AL -3.3%
- Danville, IL -3.3%
- Topeka, KS -3.5%
- Lafayette, LA -3.8%
- Duluth, MN-WI -4.1%
- Odessa, TX -7.3%
- Houma-Thibodaux, LA -7.8%
- Bloomington, IL -8.0%
California leads all states with three of the top ten performing metropolitan areas. Midland, TX led all metro areas with a 2015 growth rate of 9.4%. Illinois has the most metropolitan areas in the bottom ten in terms of GDP change, including Bloomington, which had its GDP shrink by -8.0%. It is worth noting that the bottom three metro areas with the largest drop in GDP in 2015 seem to be outliers. Bloomington, IL at -8.0%, Houma-Thibodaux, LA at -7.8%, and Odessa, TX at -7.3% all performed far worse than the fourth lowest performing metro area, Duluth, MN-WI, with a comparatively modest GDP change of -4.1%.
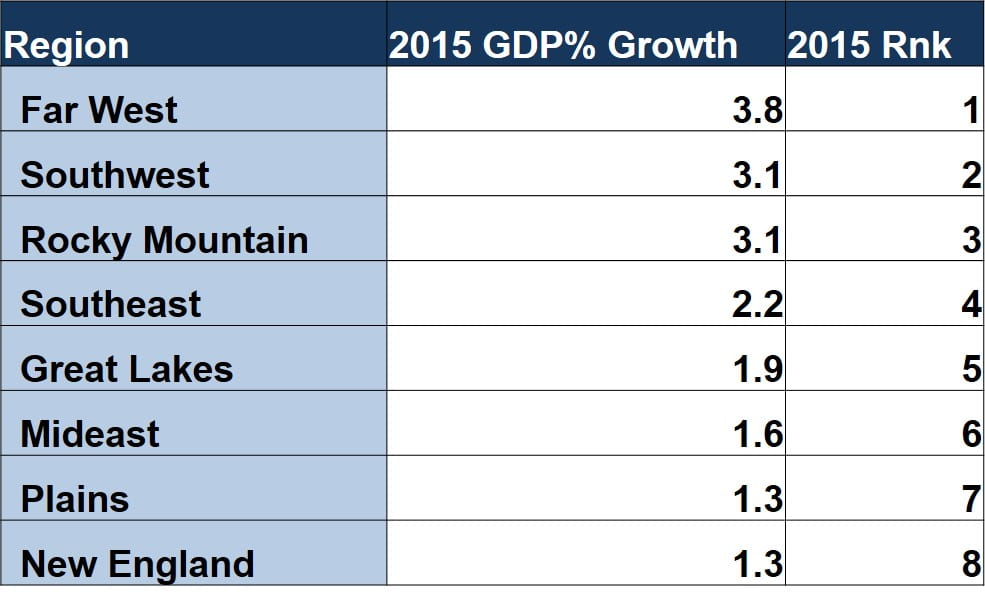
Looking at the map below, with the dark blue representing the highest metropolitan GDP growth in 2015, one can see clusters along the Pacific coast, Texas, and the Rocky Mountain states of Colorado, Utah, Idaho, and Montana reflect the Regional GDP numbers released earlier this year and listed in the table below.
Data provided by U.S. Bureau of Economic Analysis
Access to the full set of data provided by the BEA can be found here.