2015 GDP Numbers Show Shifting Regional Momentum
This week, the U.S. Bureau of Economic Analysis released their Gross Domestic Product numbers for each state and region for the fourth quarter of 2015 and the 2015 calendar year. The aggregate change for the U.S. as a whole was growth of 2.4%, up from 2.2% in 2014. These U.S. numbers are slightly different from the numbers commonly reported for the nation in other reports, as they do not include overseas economic activity of the Federal government.
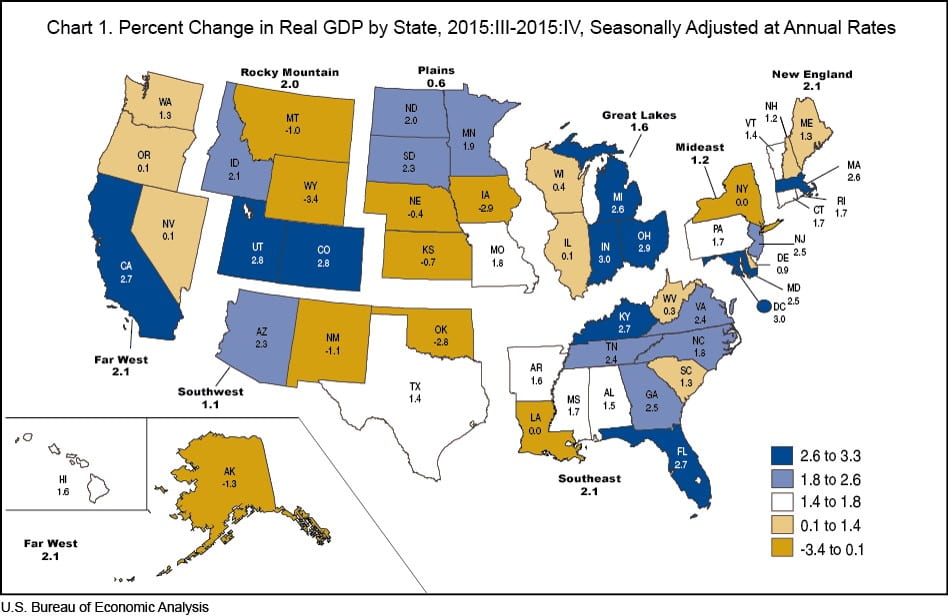
States are grouped by the BEA into eight separate geographical regions. Looking at the top and bottom performers in the fourth quarter, we see that the top two states, Indiana and Ohio, are both in the Great Lakes region. Florida, Alaska, and Iowa represent the Southeast, Far West, and Plains regions, respectively. Notably, five states, Colorado, Utah, and Wyoming from the Rocky Mountain region, and Oklahoma and New Mexico from the Southwest region, round out the top ten.
Biggest Movers – State GDP 4th Quarter 2015
TOP FIVE:
- Indiana – 3%
- Ohio – 2.9%
- Colorado – 2.8%
- Utah – 2.8%
- Florida – 2.7%
BOTTOM FIVE:
- Wyoming – -3.4%
- Iowa – -2.9%
- Oklahoma – -2.8%
- Alaska – -1.3%
- New Mexico – -1.1%
It is worth contemplating why five of the ten states whose economies made the biggest swing one direction or another are from two adjacent western regions. Wyoming, Alaska, Oklahoma, and New Mexico are first, second, fourth, and eighth among all states in terms of oil, gas, and mining as a percentage of their state economies, according to work done by Lucy Dadayan and Donald Boyd at the Rockefeller Institute of Government. The continued weak crude oil prices of 2015 go far in explaining the performance of Wyoming, Oklahoma, and Alaska.
The strong performances of Utah and Colorado are less clear, considering these states are adjacent to Wyoming, New Mexico, and Oklahoma. Colorado also has a significant oil, gas, and mining industry. It would be interesting to note if their fortunes were due to any migration patterns of people and investment from one state into another during this quarter, or if the growth in Colorado and Utah was organic.
The map below is provided courtesy of the Bureau of Economic Statistics, and breaks out each region. The colors define tiers of performance, and illustrate the significant movements in the Rocky Mountain and Plains regions. The largest core of strong performers is a four-state cluster of Michigan, Ohio, Indiana, and Kentucky.
How Regions Rank
MuniNet ranked the eight regions categorized by the Bureau of Economic Analysis by GDP growth rate for the full calendar year 2015, and compared to the growth rates in 2014 and corresponding rankings. We highlighted which states fell or rose in the rankings; only the Great Lakes region held steady as the fifth fastest growing region. We also pointed our the biggest movers. The Far West jumped up two spots to number one, with the biggest rate increase, from 2.8% to 3.8%. The Plains region fell three spots, from fourth to seventh.

Data Source: U.S. Bureau of Economic Analysis
Taking a deeper look at the data shows much going on underneath the surface of the overall national figures. Clear clusters of strong and weak performing states are revealed. Our state and local economies influence he we perceive the country is doing, in as much as GDP is a proper measurement of economic performance. Access to the full set of data provided by the BEA can be found here.