by Bradford Langs CFA
The U.S. economic recovery is nearing its seventh anniversary, although this recovery has been deemed modest at best. On the state and local level, outlooks vary and are largely dependent on employment dynamics. The Fed raised rates for the first time in 10 years by 25bps in December 2015. The probability for another rate hike during the June 2016 meeting fell to around 5% from 30% after the very weak May jobs report (the 38K number was the worst since 2010), with July’s odds falling to 40% from 60%. Watching economic data and predicting the next interest rate hike has truly been a roller coaster ride. Janet Yellen recently stated, “I will emphasize that monetary policy is not on a preset course and significant shifts in the outlook for the economy would necessitate corresponding shifts in the appropriate path of policy.” So it appears a slow process for rate increases is still on the table.
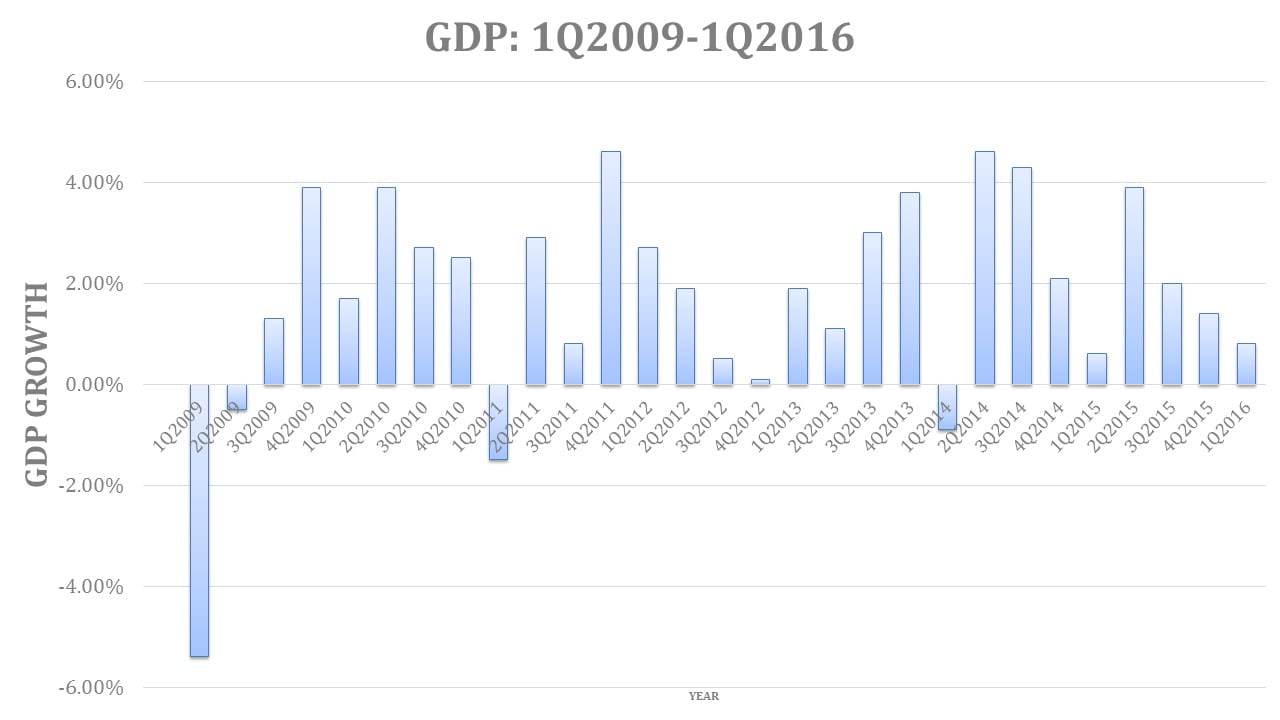
GDP growth has been somewhat erratic for several years, most recently growing only 0.8% in the 1Q2016, as shown in the following graph:
Additionally, other economic data continues to be mixed, although with an overall positive bias.
- Inflation: running at a modest 1.1% for the last 12 months
- The dollar: continues to be very strong, with U.S. Dollar Index standing in the 95 range, vs. an 80 range several years ago
- Job growth: averaged about 178,000 per month thru April, then nose-dived to $38K in May
- Unemployment: dipped below 5%; however the labor participation rate fell to 63%
- Yield curve: the 10-year Treasury yields are around 1.70%, with a relatively flat curve (spread between 2-year and 10-year is only 94bps)
- Oil prices have climbed to about $50/barrel, from lows earlier this year around $28/barrel
- Auto sales remain robust at an annualized 17 million run rate
- Stock market (DJIA) is up modest 2.4% year-to-date
So the national economy is modestly improving, but what is happening in your backyard? There are certainly regional and state pockets within the country that are performing just fine. In this study, select housing (building permits, mortgage delinquencies and mortgage foreclosures) and employment (jobs and unemployment rates) data are examined to determine trends. Housing and employment data were selected as they are generally considered leading or coincident economic indicators. The analysis compares current levels of these 5 indicators for all 50 states today vs. a year ago. As this information is tracked over time, it can provide a rather good indicator of how individual state economies are either improving or declining. The study is not intended to determine which are the best or worst performing economies, but rather what direction the economies are heading. It is interesting to look at national, regional, state, and even county trends.
Focus on State Results
4Q2015 STATE RANKINGS
Top 10 / Bottom 10

National Results:
On the national level, all five indicators showed a positive trend. Either 4 or 5 indicators have been positive since 3Q2011. The magnitude of improvement has slowed somewhat, indicating the recovery is ongoing but modest. For 4Q15 vs. 4Q14, national results follow:
- Employment increased 0.6%
- Unemployment fell 12.3%
- Mortgage delinquencies declined 15.9%
- Mortgage foreclosures decreased 17.8%
- Building permits improved 12.9%
Regional Results:
Improving trends are most visible in the Pacific (California, Washington, Oregon and Hawaii) and Mountain (Colorado, Nevada, Utah, and Arizona), followed by South Central (Tennessee) and New England (Massachusetts and Connecticut) regions.
Softer trends are present in the North Central (South Dakota, North Dakota, Kansas and Nebraska), and South Central (Oklahoma, Louisiana and Texas) regions.
State Results:
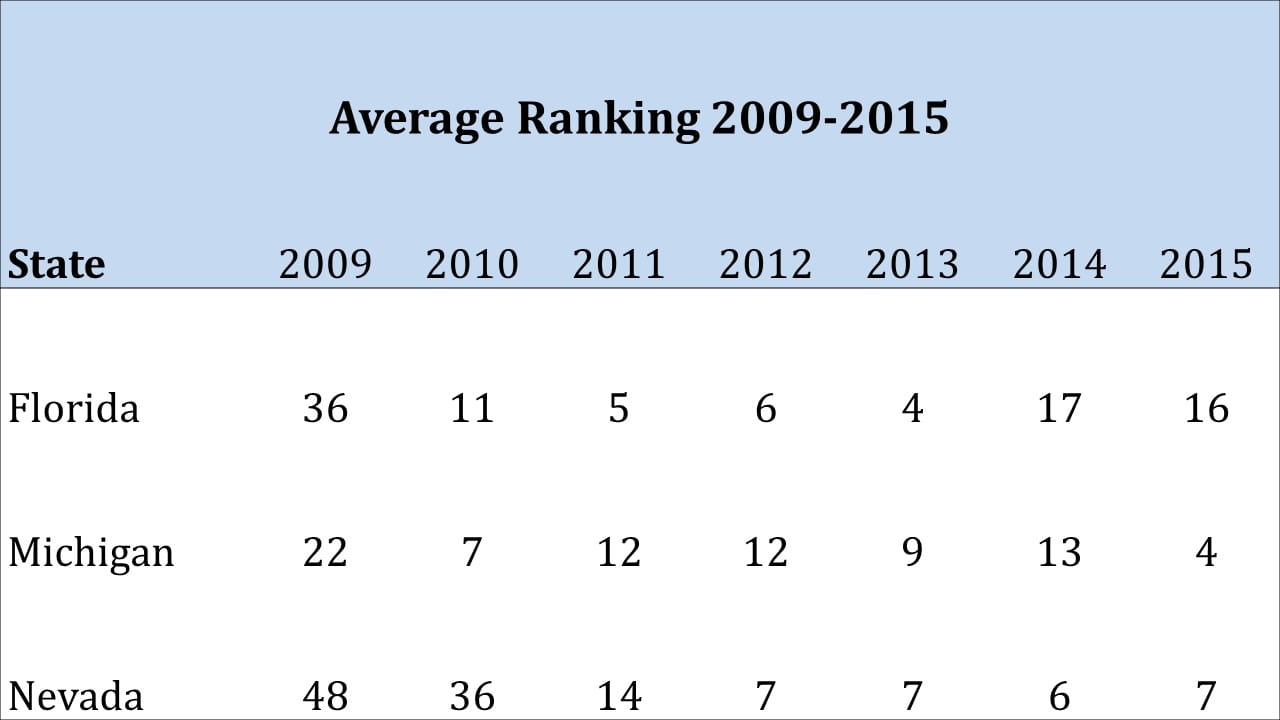
On the state level, areas that were particularly hard hit during the recession appear to be on the mend, including Nevada, Florida and Michigan. The following chart demonstrates this improvement, and shows the power of looking over historical time periods for trends (especially over a business cycle).
Several states have been exhibiting very strong growth for the past several years, including Arizona, California, Colorado, Idaho, Minnesota, Oregon, Utah and Washington.
States that have been struggling for the past several years include Alabama, Alaska, Kansas, New Mexico, Oklahoma, Pennsylvania, and West Virginia.
The U.S. economy continues to exhibit mixed trends, although the overall bias is towards positive growth. The recovery is uneven, with pockets of strength and weakness existing in different geographic regions and different states. Not surprisingly, states that generally perform well have diversified economies which include industries such as government, healthcare, military and technology. During this recovery, some more cyclical industries such as auto and airlines have been helping generate jobs. Therefore, it is important to look at trends over several quarters to get a clearer picture of change.
Bradford Langs, CFA, is the Chief Risk Officer at CoastalStates Bank in Hilton Head Island, South Carolina. He has over 25 years of experience in portfolio, credit and risk management from Wall Street to Main Street. He has compiled the quarterly Economic Indicators Report, based on two data sets on the employment side (employment and unemployment) and three data sets related to housing (building permits, mortgage delinquencies and foreclosures) for over 20 years.
[table id=6 /]