Why is it important to pay state and local government debt?
by James Spiotto
Past economic downturns have taught us the importance of state and local governments to timely pay their public debts:
Panics, recessions and depressions: Since 1793 we have had 6 panics, 38 recessions and 4 depressions – The last depression being the Great Depression of the 1930 and the last recession the Great Recession of 2008.
The price of repudiation of the obligation to pay debts timely: Between 1841 and 1843 eight states and one territory (now a state) repudiate their debt and seven states between 1843 and 1848 resumed payment. While some attribute the repudiation to the aftermath of the Panic of 1837, the real reason lies in developing states borrowing money to pay for needed transportation improvement given the success of the Erie Canal or for needed banking services in the state. By 1844, nineteen states and two territories had borrowed money for needed economic growth. The inflationary boon of 1834-39 with the accompanying Panic of 1837 came to end by 1841 and there was a tightening of credit that put pressure on incomplete construction projects for transportation improvements in the North (Pennsylvania, Maryland, Indiana, Illinois and Michigan) and lack of credit for banks in the South (Arkansas, Louisiana, Mississippi and Florida Territory). Those eight states and territory then in the 1840’s repudiated their public debt due to lack of funds to pay. But the consequences of this repudiation were difficult for them to survive. All but the Florida Territory and Mississippi resumed payment by 1848. The reason was the cost of default’s denial of access or increase in cost of borrowing. Those that repudiated but resumed payment experienced borrowing yields to complete project of 32% until they resumed payment and then paid 4% above market to borrow. Mississippi and Florida Territory lacked access to then public market for almost two decades. (English, 1996; Wallis, Sylla and Grinath, 2004; Sturzenegger and Zettelmeyer, 2007)
The cost of default: The price of default in either increased borrowing costs or denial of access to the market was demonstrated by those States in the 1840s who cured the repudiation or default suffered high interest rates (32% + yield) until resuming payment and even increased rates (4% + addition yield) after resuming payment on repudiated debt. Those who never cured default were denied access for decades (while financial memories lasted):
- Civil War repudiation and affirmation of the obligation to pay public debt of the United States. Eight Southern States (Alabama, Arkansas, Florida, Georgia, Louisiana, Mississippi, North Carolina and South Carolina) after the Civil War repudiated indebtedness and still do. The reasons vary but generally are attributable to debt involuntarily incurred during the “carpet bag” governments. The Fourteenth Amendment was enacted in part to assure payment of public debt of the United States and its States but not in aid of the insurrection which shall be illegal and void. (U.S. Constitution Fourteenth Amendment Section 4). The Civil War debt of the Confederate government was approximately $1.4 billion and the Confederate states had individual Civil War debt of about $67 million. (Noll, 2012)
The repayment battle: In 1860, before the start of the Civil War, public debt was about $65 million and after the Civil War was about $2.7 billion (after deducting cash in the treasury). Public debt after the Civil War was 41 times larger than at the start. The per capita cost of public debt rose from $2.06 in 1860 to $75.01 in 1865 (in May 2014, $75.01 in 1865 equaled $14,000.00 in May 2014 using nominal GDP per capita, see Williamson, 2012). Given the 14th Amendment, Section 4, the battle was over whether to pay the debt in gold or in greenbacks. The United States had gone off the gold standard and greenbacks were a devalued currency. Democrats favored paying in greenbacks. Republicans favored paying in gold. In March 1869, President Grant, a Republican, took office and in his inauguration speech following the statement of Washington and Hamilton 80 years earlier, he said, “to protect national honor every dollar of government indebtedness should be paid in gold.” (Noll, 2012)
Expansion of state and local government debt and the Depression of 1873: Between 1850 to 1870, public debt of local governments in the United States rose over 10 times from $50 million to $516 million. The Depression of 1873 led to a flood of state and local government defaults between 1873 to 1879. Approximately 25% of the $1 billion state and local government debt defaulted during this period. The cause was over- expansion and investment in railroads, real estate and nonessential services.
Again the consequences of repudiation was that state and local government debt must be paid for market credibility: Railroad Cases. The Supreme Court ruled in over 300 cases between 1860 and 1896 that efforts by state and local governments to repudiate and invalidate bonds issued to subsidize railroad facilities violated the Constitution and thus the rights of secured bond investors. The Supreme Court took a consistent and clear stand upholding the validity of the bonds sometimes overruling state supreme courts. Gelpcke v. Dubuque, 68 U.S. 175 (1864); Havemeyer v. Iowa County, 70 U.S. 294 (1866):
- The consequences of the 1860-1870 defaults. The reaction to these defaults, “moral obligation” bonds was to assure payment by legislation recognizing the validity of the debt and giving bondholders rights and protections to discourage any repudiation or default on public debt.
- Safeguards to protect bondholders. As a reaction to the events described above, in the late 1800s and early part of the 20th century, states enacted legislation to give bondholders greater rights and protection and to prevent unnecessary defaults on municipal obligations. The municipal bond market in effect mandated necessary changes in the documentation, legal authorization, and structure of municipal financing, which included:
- debt limitation on municipal issuers to prevent excessive borrowing;
- clearly defined bondholder rights in the event of default supported by statutory and case law;
- use of bond counsel to determine the legality of the bond issue before the sale to avoid technical legal defects that could allow an issuer to repudiate the debt;
- development of credit rating agencies as well as thorough credit review by investment firms and many institutional investors;
- statutory restrictions against municipal issuers borrowing for chronic deficiencies; and
- the use of indenture trustees, paying agents, and other who have certain fiduciary duties in order to protect the rights and interests of bondholders.
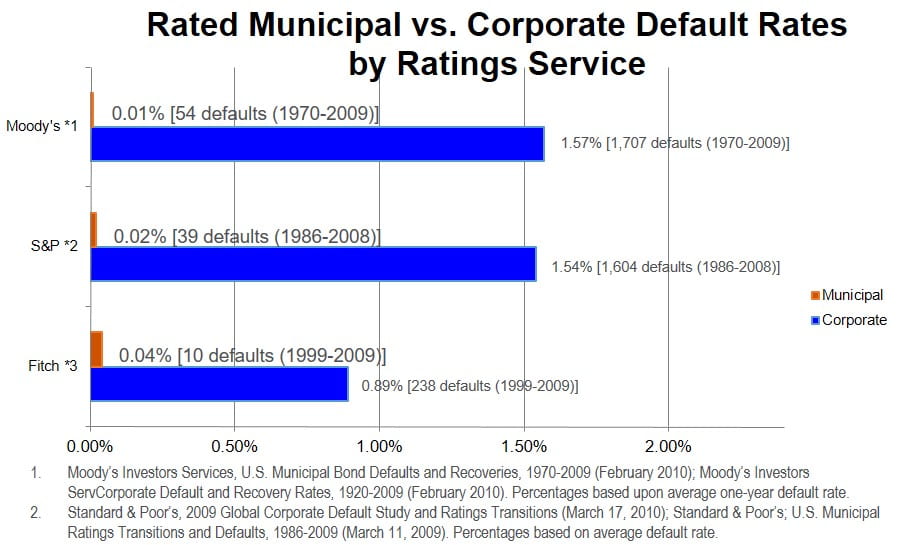
Default rate for state and local government debt has been relatively low especially when compared to corporate debt default
Historically, while political risk of non-payment was a possibility, it was a rare occurrence, if not in reality a non-existent concern, with a few exceptions (i.e. 8 States and one Territory repudiated their debt between 1841 to 1843 with 7 of the 9 resuming payment by 1849, repudiation of Civil War related debt by 8 states in the late 1860’s, railroad bond and real estate defaults of the 1870s to 1890s and Washington Public Power Supply System, 1983). There are current situations that may test the long-term viability of the historical premise. Namely, it is hoped that Detroit, Stockton, San Bernardino and Jefferson County are rare aberrations rather than indicative of a growing trend:
Historically, there is a low default rate for bonds issued by municipalities and states:
- The late Dr. John Petersen of George Mason University noted in his paper on “Municipal Defaults: Eighty Years Made a Big Difference” (2011) that, between 1970’s-2000’s, the municipal default rate for municipalities averaged per decade .10% to .24% (adjusted for WPPSS and Jefferson County, Alabama) not including the fact that over 80% of the defaults were conduit financing and not essential public financings. This is a far cry from corporate bond default rate on average for investment grade and non-investment grade of about 10%. (Petersen, 2013)
- States have not defaulted on general obligations bonds since the late 1880’s, with the exception of Arkansas in 1933, which was thereafter refinanced.
- Historically, based on default rate, there is little support for the willingness to pay to be deemed a real problem since there is an absence of political risk.
- Essential service debt financing has historically enjoyed a significantly lower default rate than healthcare, housing and conduit state and local governmental financing.
- Unfunded pension obligations and deferred infrastructure cost are a more recent phenomenon – Prior to 1960s, most pension obligations were treated as gratuities and a significant number of big ticket infrastructure costs are only now starting to age such as the interstate highway system, electric grid, waste water treatment facilities, etc.
- We are closer to a tipping point and departure from the historical assurances than we have ever been. The difference may be whether there is Market Discipline going forward.
Frequency of Municipal Defaults:
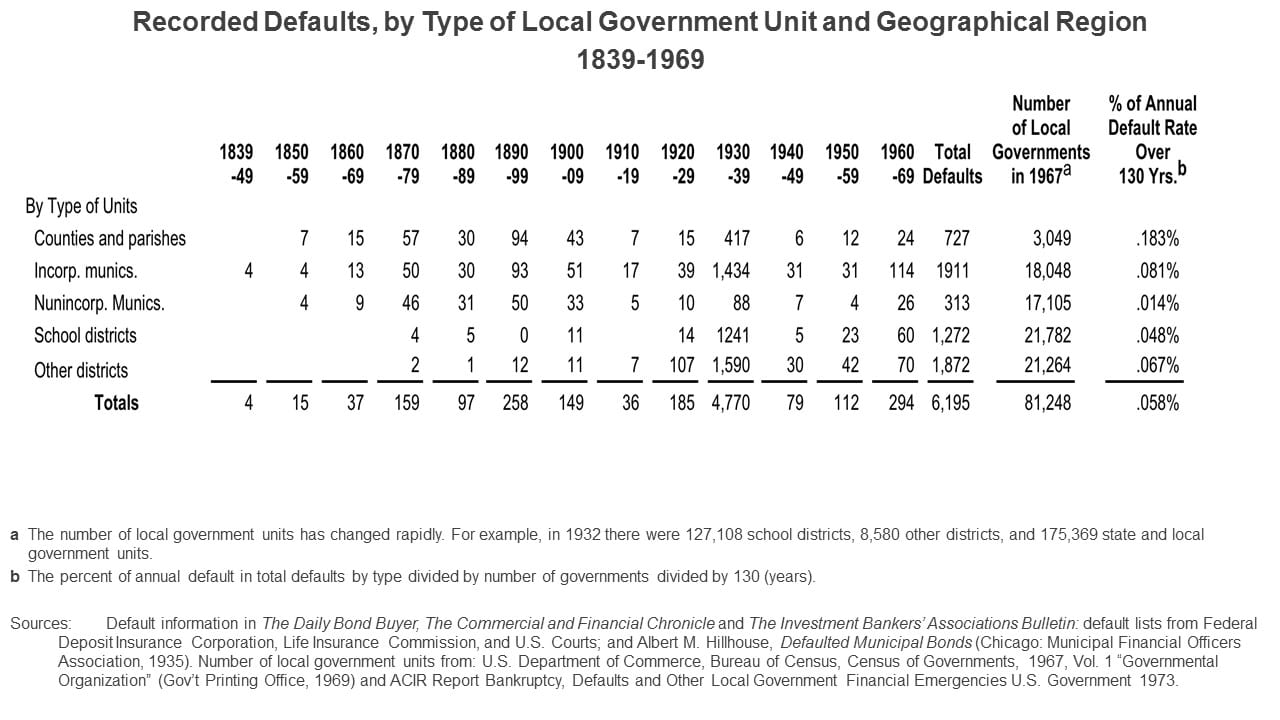
- Less than 12,000 defaults since 1839 for over 90,000 state and local governments in the U.S.A.
- There were 6,195 defaults between 1839-1969 in the U.S.A. consisting of:
- 727 counties and parishes.
- 1,911 incorporated municipalities.
- 313 unincorporated municipalities.
- 1,372 school districts.
- 1,872 special purposes districts.
- (4,770 default between 1929-1937).
The History of Payment of State and Local Government Debt in the United States and Summary of Significant Chapter 9 Events during 2011, 2012, 2013, and 2014
 Moody’s “U.S. Municipal Defaults and Recovery 1970-2013”:
- Municipal bond defaults for rated bonds (“defaults”) remains extremely low namely is 1.3 defaults per year on average between 1970-2007 period (0.01%) and 5 defaults per year from 2008-2013 period (7 in 2013 and 5 in 2012 with an average of 5 defaults) or 0.03%.
Moody’s “U.S. Municipal Defaults and Recovery 1970-2013”: - The ultimate recovery rate remains higher than corporate defaults with at least 60% recovery for the 1970-2013 period for municipal rated bonds versus 48% recovery for corporate senior unsecured rated bonds. Ranges vary by case – Jefferson County at least 80% for sewer bonds class, 100% of principal for G.O. warrants, Vallejo, Sierra King. 100% recovery for special revenues.
- Historically, based on default rate, there is little support for the willingness to pay to be deemed a real problem since there is an absence of political risk. Will this premise be tested?
- Essential service debt financing has historically enjoyed a significantly lower default rate than healthcare, housing and conduit state and local governmental financing.
- Recently monetary defaults on state and local government public debt ranged from 108 issuers for $1.95 billion in default in 2012 to 68 issuers for $8.57 billion in default in 2013 to 58 issuers for $9.02 billion in default in 2014. (See Municipal Market Advisors and Bond Buyer) While there was a decline in the number of issuers in default by almost 50%, there was however the rise in dollar value of defaults in 2013 and 2014. This was due to Detroit’s filing for bankruptcy and defaulting and a large energy company bankruptcy. For example, $5.4 billion of the $9.02 billion in default in 2014 were the Detroit water and sewer bonds that ultimately were unimpaired in the plan of debt adjustment. In addition, TXU, a subsidiary of Energy Future Holdings Company, declared bankruptcy in April 2014, which filing caused the default on $1.16 billion of Industrial Development Bonds.
- Unfunded pension obligations and deferred infrastructure cost are a more recent phenomenon – Prior to 1960’s most pension obligations were treated as gratuities and a significant number of big ticket infrastructure costs are only now starting to age such as the interstate highway system, electric grid, waste water treatment facilities, etc.
- We are closer to a tipping point and departure from the historical assurances than we have ever been. The difference may be whether there is Market Discipline going forward.
James E. Spiotto, Co-Publisher © James E. Spiotto. All rights reserved (2015).
Additional References
English, William B. Understanding the Costs of Sovereign Default: American State Debt in 1840’s. Electronic copy available at www.jstor.org/stable/2118266, 1996.
Hillhouse, A.M. Municipal Bonds – A Century of Experience. New York: Prentice-Hall Inc., 1936.
Noll, Franklin. Repudiation! The Crisis of United States Civil War Debt 1865-1870. Electronic copy available at: http://ssrn.comabstract=2196409, 2012.
Petersen, John E.. Municipal Defaults: Eighty Years Make a Difference. Municipal Finance Journal, Vol. 33, No. 4, Vol. 34, No. 1, Winter/Spring 2013 Parts 1 and 2.
Spiotto, J., A. Acker and L. Appleby. Municipalities in Distress? How States and Investors Deal with Local Government Financial Emergencies. Chapman and Cutler LLP, 2012.
Sturzenegger, F. and J. Zettelmeyer. Debt Defaults and Lessons from a Decade of Crisis. Boston: MITPress (2007).
Wallis, J., R. Sylla and A. Grinath. Sovereign Debt and Repudiation: The Energizing Market Debt Crisis in the U.S., 1839-1843, NBER Working Paper Series (Working Paper 10753) (2004).