by James Spiotto
A. Past market discipline and state and local governments need to borrow:
- As noted, in the 1800’s and 1900’s, states and local governments in order to fulfill their mandated mission borrowed for needed infrastructure and essential governmental services at an acceptable level. It has been that ability to borrow that has funded the world’s best infrastructure.
Our states and local governments have built the world’s largest infrastructure for the world’s largest economy. The United States contains the most extensive and sophisticated public works system in the world including 4,042,778 miles of roadways, 603,259 bridges, 1,100 local bus systems, 19,750 airports (of which 5,178 are for public use), 25,320 miles of inland and intercoastal waterways, almost 84,000 dams, more than 2 million miles of pipe in water supply systems and over 15,000 wastewater treatment plants provided mostly by municipalities and political subdivisions of a state. The American Society of Civil Engineers (“ASCE”), in its 2013 Report, estimates the cost to maintain this infrastructure at a passable level will be $3.6 trillion by 2020 or about 4 times the annual tax revenues for all state and local governments. In 2009, ASCE’s number for the next 5 years was $2.2 trillion. Inattention has caused the number to increase by $1.4 billion in 5 years.
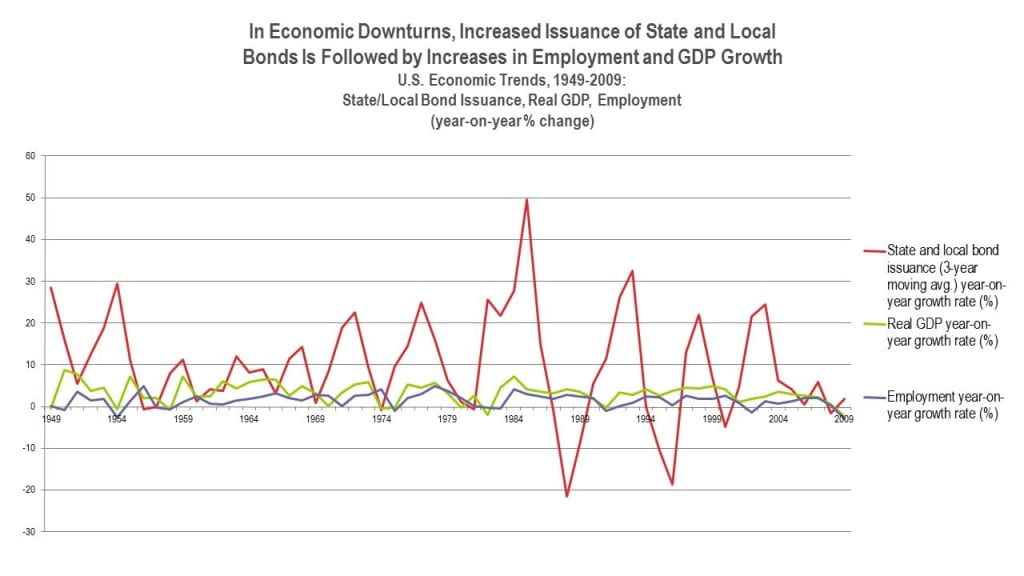
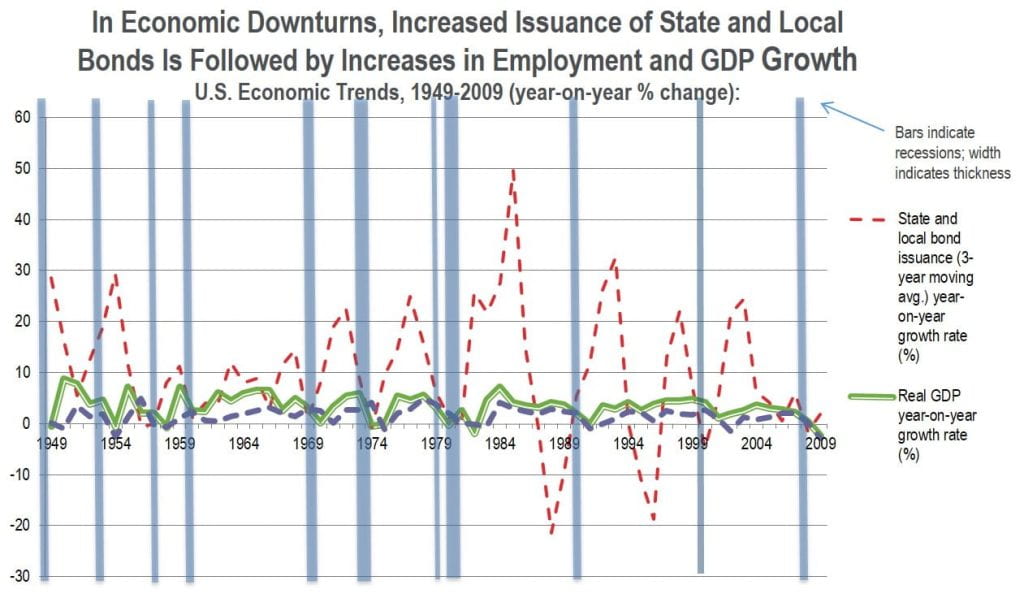
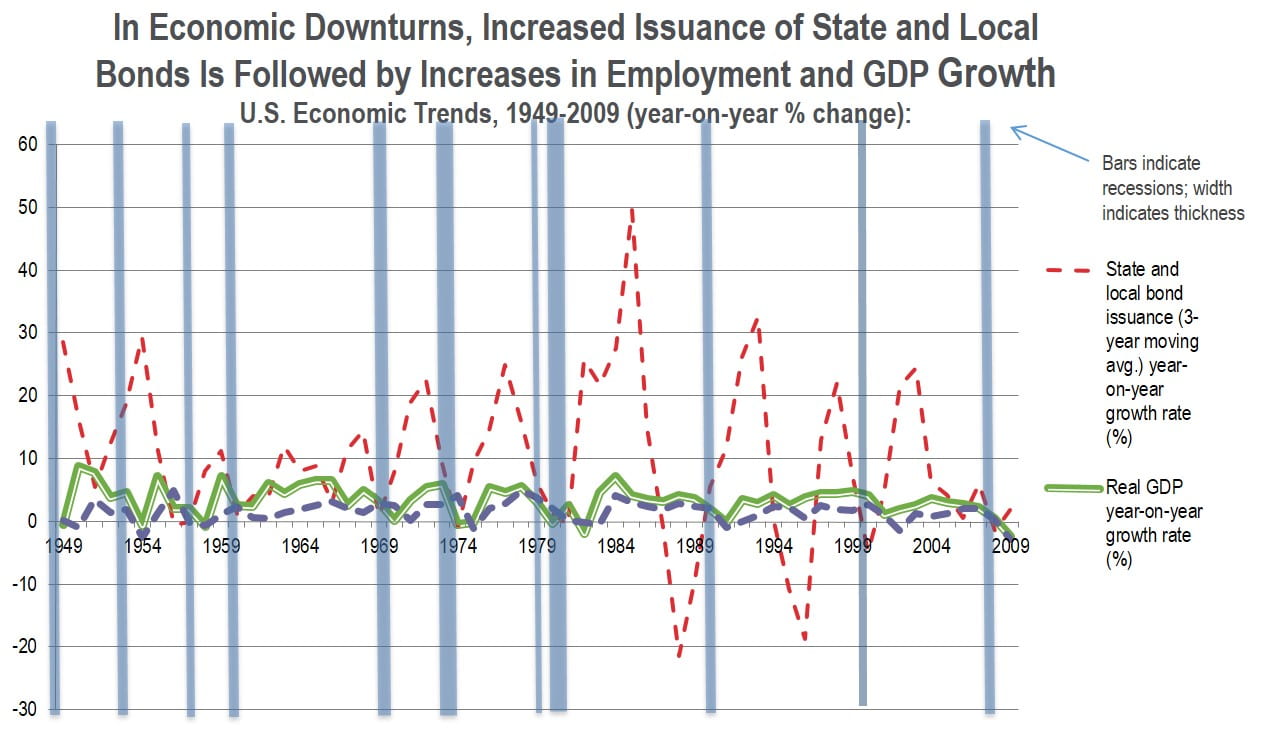
Continued borrowing is required to fund needed infrastructure and stimulate the economy as demonstrated by increased borrowing after each economic downturn since 1949, except the last one (2008).
- Investment in infrastructure and governmental services returns significant benefits:
- In the short run, a dollar spent on infrastructure produces roughly double the initial spending in ultimate economic output.
- Over a 20-year period, generalized “public investment” generates an accumulated $3.21 of economic activity for each $1.00 spent. (Same ratio that was noted during the Depression of 1929-1939.)
- Over 20 years, investing $1.00 in highways and streets returns approximately $0.35 in tax revenue to the federal and state/local government of which $0.23 specifically accrues at the federal level.
- Over 20 years, investing $1.00 in sewer systems and water infrastructure returns $2.03 in tax revenue to federal and state/local government of which $1.35 specifically accrues at the federal level.
- The U.S. on the federal level is spending on infrastructure is the lowest percent of GDP since 1947, namely 3.6% compared to an average of 5%. (Cohen, Freiling and Kobenson, The Economic Impact and Financing of Infrastructure Spending (2012))

- Historically, government finance officers did anything they could to avoid default due to the essential need of any government of size to access the municipal market to cover financing of infrastructure and essential services at a low cost (the investment mandate).
- Municipalities and states fear default would lead either to limited or no access to the Municipal Bond Market or significant increase in the cost of borrowing (increased interest costs). This would limit or deprive states or municipalities of their present ability to decide locally what infrastructure improvement or what essential services they will finance and to finance such themselves rather than to obtain the consent or approval of a higher government that has the ability to obtain financing and possibly a different agenda.
B. Diversification of tax sources to prevent over- concentration of source of funding. Since the Depression of the 1930’s, state and local governments have diversified the source of tax revenues to reduce reliance on property taxes and to spread the burdens and reduce the risk of concentration – that diversity of tax sources has made a real difference in the eleven economic downturns since 1949 especially in 2008.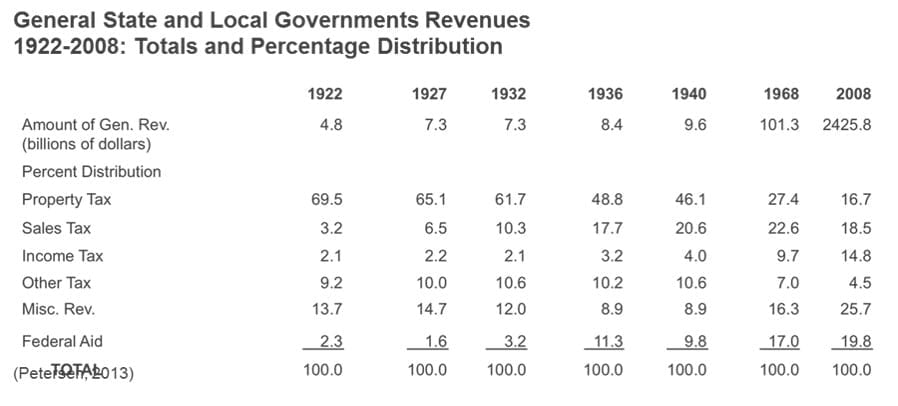
- Property, income and sales taxes made up over 70% of state and local governments revenues in 1922-1940 but only 50% of state and local governments revenue by 2008. More diverse and varied tax base in 2008 with more federal assistance.
- Property taxes which made up over 60% of the revenues of state and local governments between 1922-1932 was only 16.7% of revenue by 2008 with increases in sale, income other, miscellaneous and federal aid making up the difference.
C. Use of debt limitation and tax limitation:
- Virtually all states impose some sort of limitation on the amount of debt or tax limitations or both.
- Municipal debt limits range from a percentage of a valuation of assessed property to a monetary amount.
- States handle debt for essential services differently than non essential.
- There have been recent attempts in states to tighten local debt limits while others strengthen protections.
- Generally revenue bonds paid from the revenues of a municipal enterprise (water, sewer, bridge, tollway, electric system) are exempt from debt limits. So also are tax increment financing and appropriation bonds.
For 50 State Survey, see Spiotto, J., A. Acker and L. Appleby. Municipalities in Distress? How States and Investors Deal with Local Government Financial Emergencies. Chapman and Cutler LLP, 2012.
D. Refunding bonds are permitted in all states.
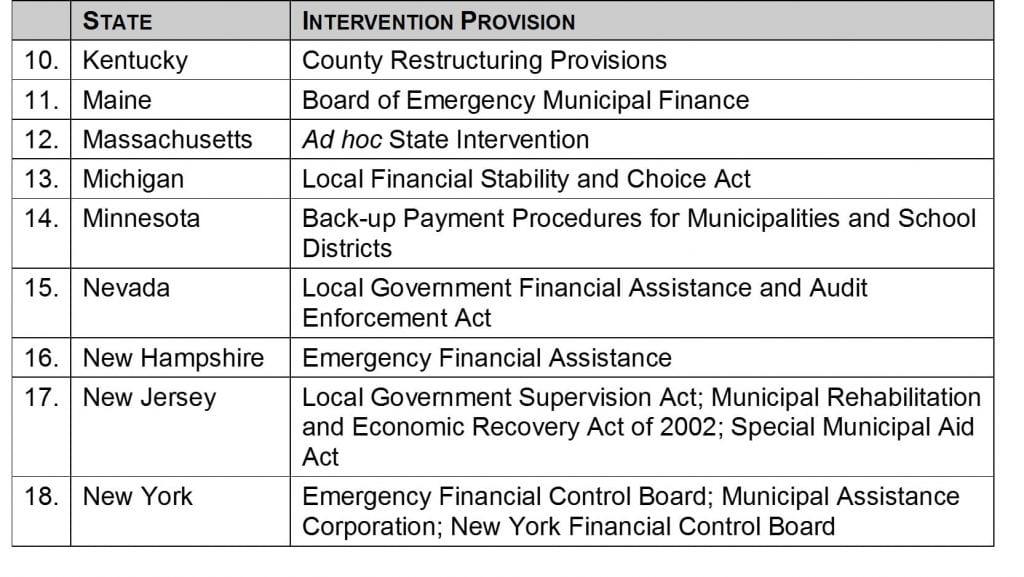
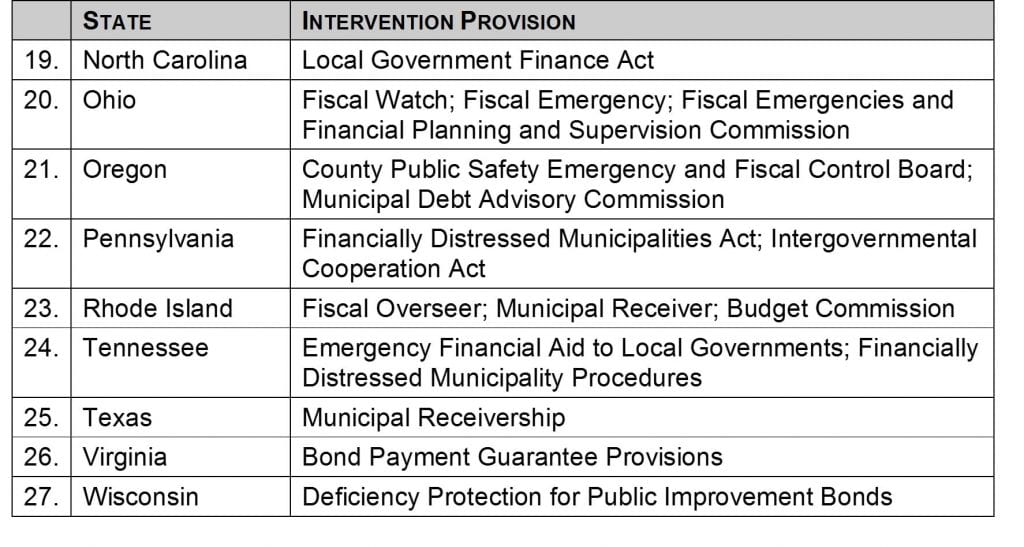
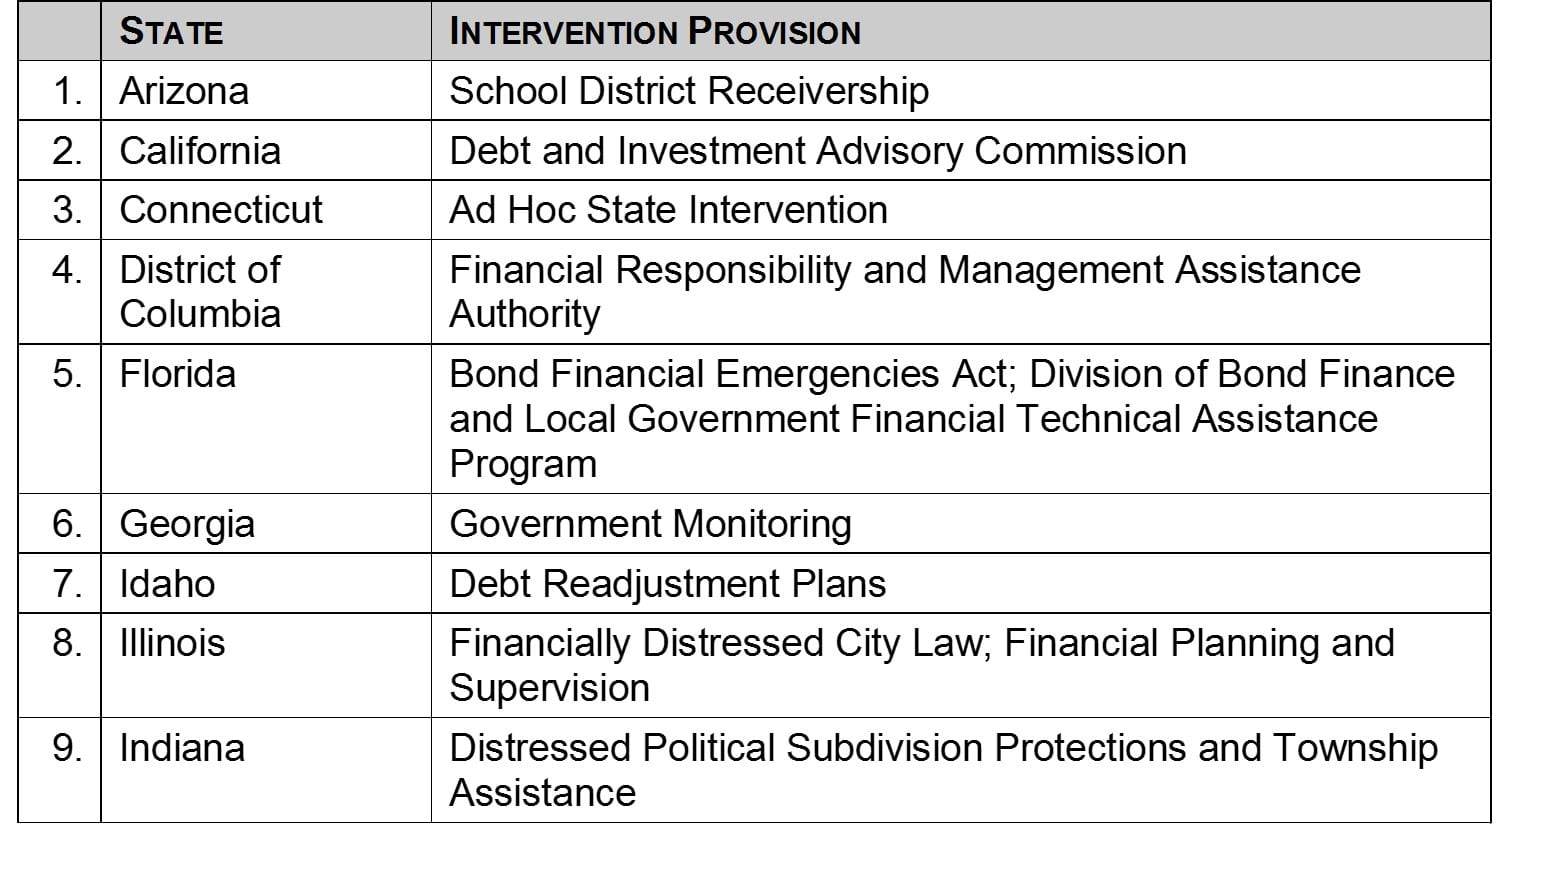
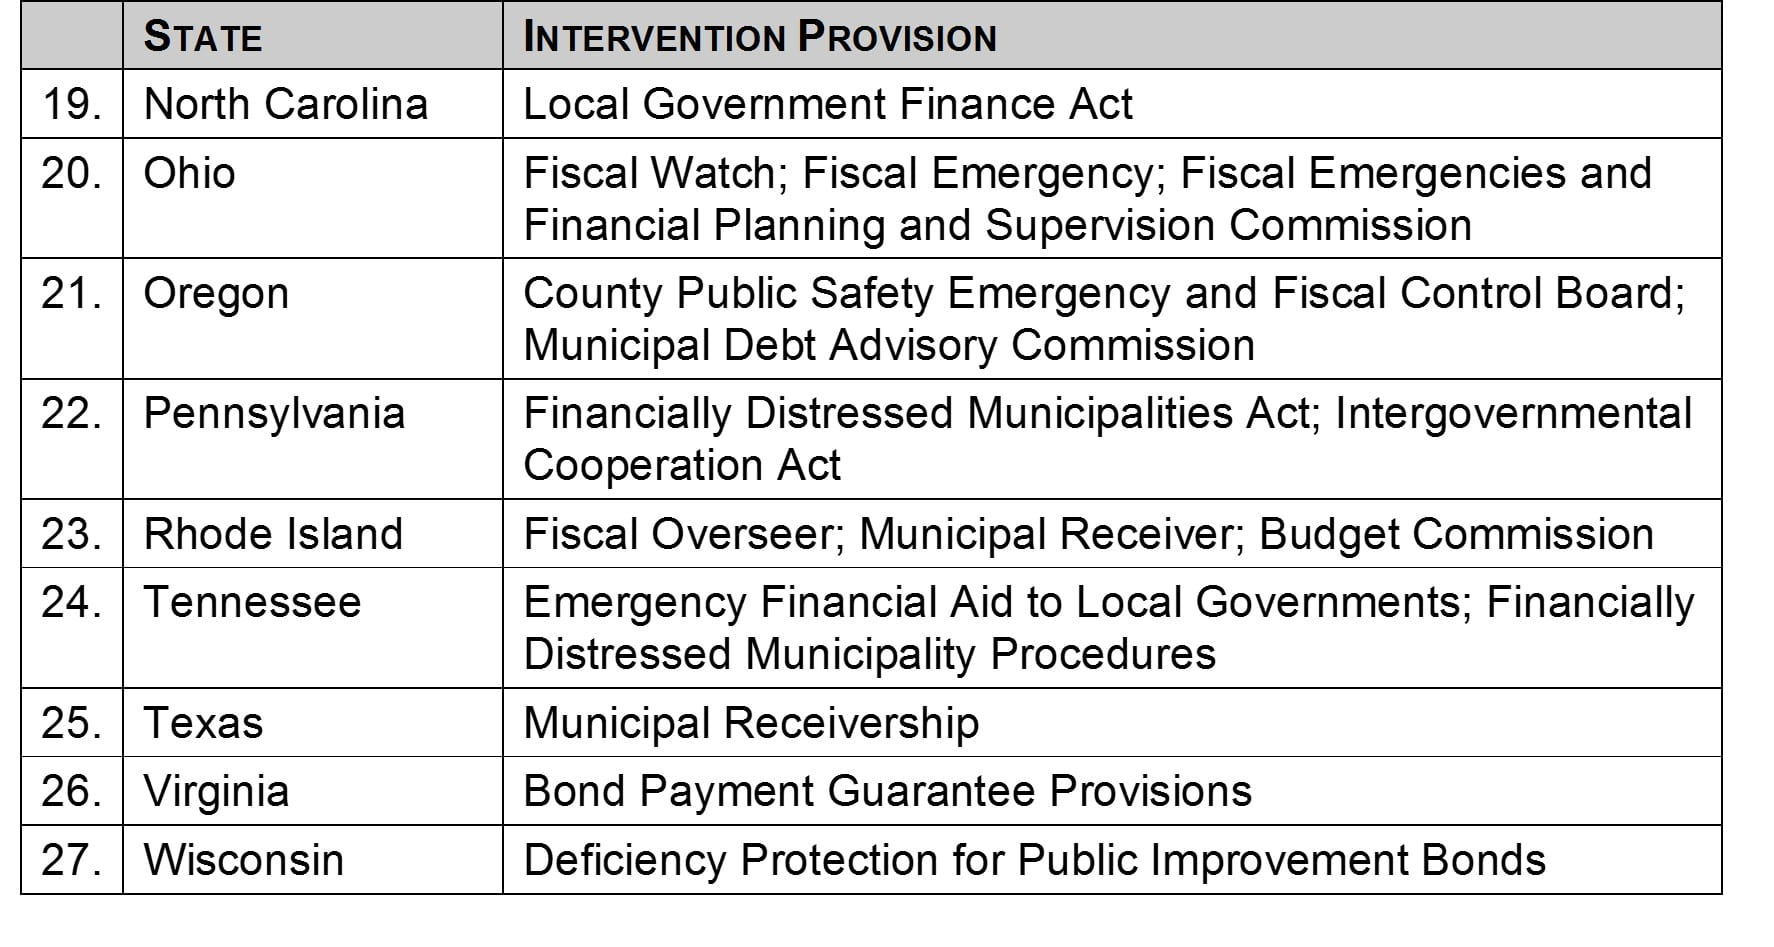
E. Growing and increased use of state oversight, supervision and assistance for emergencies of local governments:
- At least twenty-five states have implemented some form of municipal debt supervision or restructuring mechanism to aid municipalities:
- These range from Debt Advisory Commission (e.g. California) and Technical Assistance Programs (Florida) which provide guidance for and keep records of issuance of municipal debt to the layered approach of Rhode Island and Michigan of oversight, commission and fiscal manager or receiver and the overall supervision of the debt incurrence and payment process from the beginning to the end as supervised in North Carolina.
- Examples of state oversight, supervision and assistance for fiscal emergencies of local government.


- States recognize the use of a municipal receiver:
- The Rhode Island Experience and The City of Central Falls:
- Overseers.
- Budget Commission.
- Receiver.
- Chapter 9.
- Texas’ use of judicially appointed receiver vs. financial control board, emergency financial managers, coordination overseers and refinance.
- The Rhode Island Experience and The City of Central Falls:
- Financial Control Boards and Active Supervision Examples:
- The Rhode Island Experience and The City of Central Falls.
- The New York Experience – Financial Control Board.
- The Pennsylvania Experience – Act 47.
- The Michigan and Indiana Experience – Emergency Managers.
- The Massachusetts Ad Hoc Experience.
- The California Experience – Neutral Evaluator.
- The North Carolina – Local Government Commission – oversight and approval from the cradle if debt issued to annual financial reports.
- Development of a municipal protection commission as a quasi judicial entity to determine what costs are sustainable and affordable and which are not including labor costs and benefits and whether taxes should be raised or costs reduced.
- The range of powers and authority helpful to oversight and emergency financing:
- Grants from federal, state and regional governmental bodies.
- Loans from federal, state and regional governmental bodies.
- State intercepts of tax revenue.
- Involvement in local government budget process.
- Required financial performance and targeted levels of essential governmental services.
- State legislative assistance in tax revenue and powers.
- Backup by moral obligations of the state.
- Considerations regarding the appointment of authority members.
- Acceleration of loans and obligations if performance triggers are violated.
- Dealing with the press and financial disclosure issues of the distressed local government.
- What powers are essential for state oversight and assistance:
- Exploration of transfer of certain governmental services (and related costs) to other governmental bodies.
- Consolidation of regional essential governmental services.
- Power to authorize Chapter 9 if needed or bridge financing or refinancing of troubled debt.
- Use intercept of state tax payable to municipality to ensure essential municipal service.
- Private Public Partnerships – Lease and sale of municipal properties to provide bridge financing and cash flow relief.
- Vendor Assistance Program – Providing vendor payments through securitization financing of payables. Payment from dedicated tax revenues over time. Provide current cash flow relief from current or future vendor payments.
- Explore consolidation on a regional basis of certain governmental services.
- Monitor compliance with any restructuring plan to ensure compliance and prevent financial erosion.
F. Improved bondholder rights and remedies:
- Upon Default (breach of covenant or failure to make payment of principal or interest), Bondholder may institute a lawsuit for a money judgment, mandamus, specific performance, or equitable relief such as for injunction or an accounting or for foreclosure on collateral (if permitted) or other relief:
- Mandamus – all States would permit a bondholder upon default to petition for mandamus that in essence requires a Municipal official to levy taxes to pay an obligation. The problem is constitutional and statutory debt limits and time, cost and delay.
- Receiver – 46 States and Puerto Rico permit bondholders to petition a Court to appoint a Receiver upon default especially in the case of a default on the Revenue Bond for financing of a Municipal Enterprise.
- Accounting – At least 23 States and the District of Columbia and Puerto Rico allow for Bondholders or Representative to bring an action for an accounting to require the local government to account for how bond funds have been spent.
- Foreclosure – At least 28 States permit some form of foreclosure on mortgaged or secured real property upon default on a financing of that facility or structure generally related to conduit financing.
- Injunction – At least 15 States permit bondholder to obtain some form of injunctive relief upon default to protect and preserve their rights and remedies.
- Other Relief.
- (For more detail see Spiotto, Acker and Appleby Municipalities in Distress? Chapman and Cutler LLP, 2012)
G. Limited eligibility to file for municipal bankruptcy – Chapter 9:
- The municipality must be specifically authorized by state law:
- Less than half of all states specifically authorize their municipalities under state law to be a debtor in Chapter 9. Twelve states have statutory provisions in which the state specifically authorizes filing (AL, AZ, AR, ID, MN, MO, MT, NE, OK, SC, TX, WA without any conditions), another twelve states authorize a filing conditioned on a further act of the state, an elected official or state entity or neutral evaluator (CA, CT, FL, KY, LA, MI, NJ, NC, NY, OH, PA, RI). Three states (CO, OR and IL) grant limited authorization, two states prohibit filing (GA) but one of them (IA) has an exception to the prohibition. The remaining 21 are either unclear or do not have specific authorization so they cannot file for Chapter 9.
- Those municipalities that are in states that have a condition to filing Chapter 9, namely a second look by an elected official or state agency, are approximately 5 times less likely to file than those that are in states that unconditionally allow their municipalities to file.
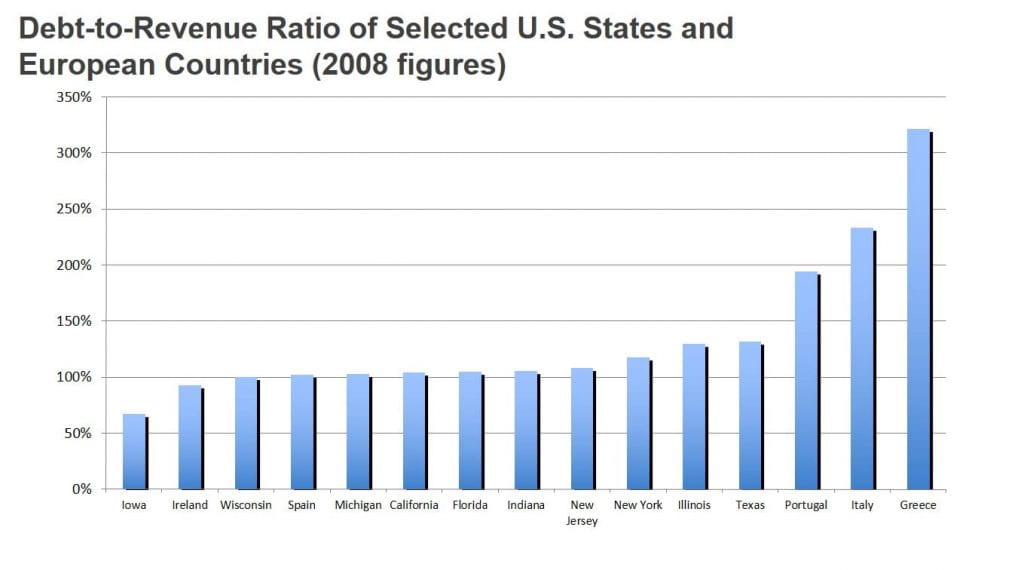
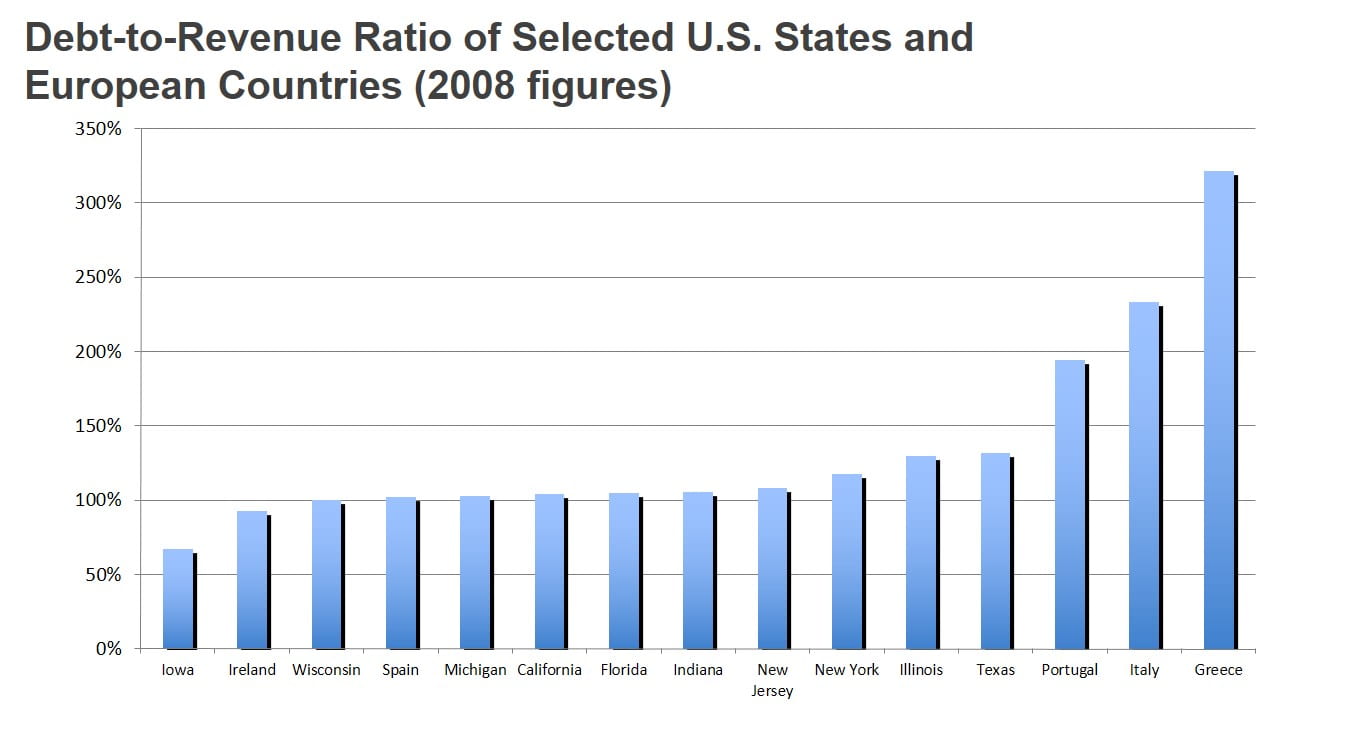
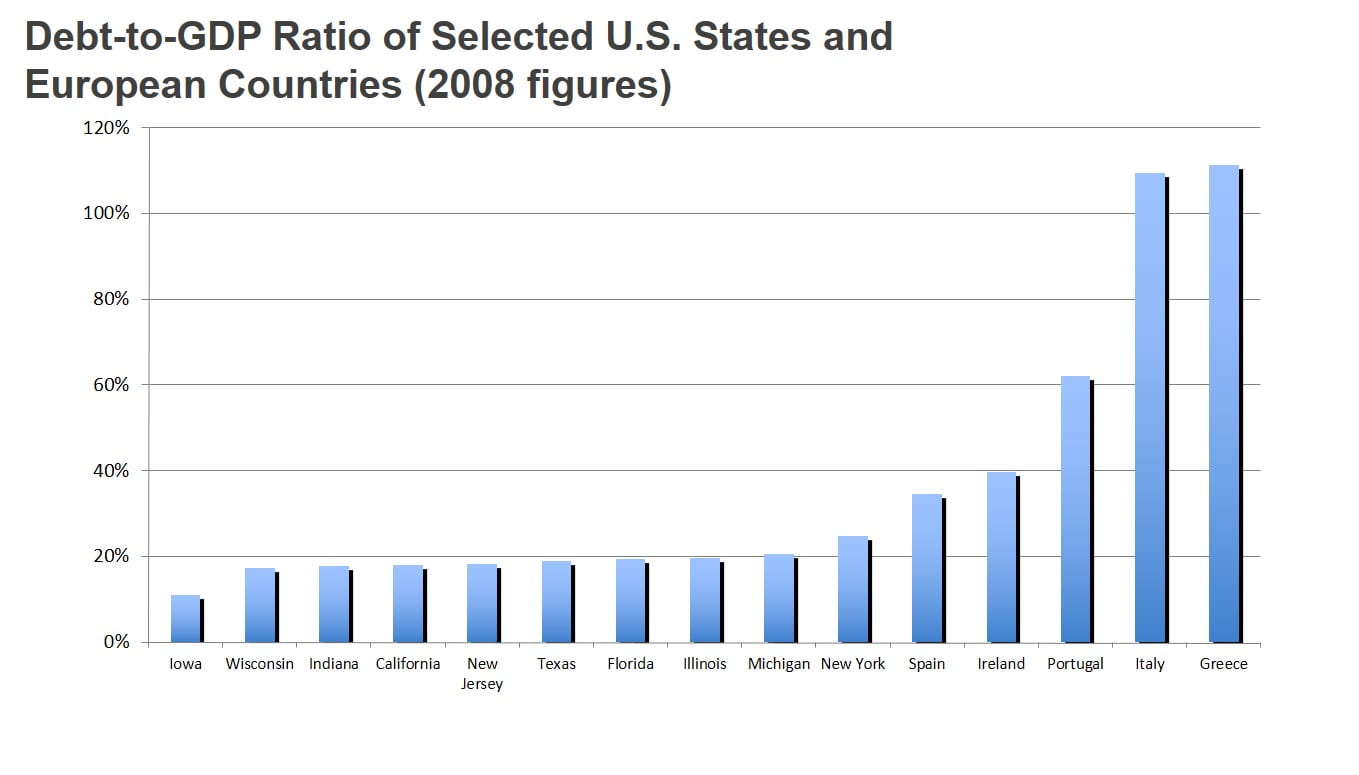
H. Our states and municipalities enjoy a favorable GDP per capita and debt to GDP and debt to revenue ratios compared to other sovereigns on a global basis:
- The per capita GDP of each of California, Texas, Florida, New York, Illinois and New Jersey (certain “Major U.S. States”) is higher than Portugal, Greece, Italy and Spain.
- The percentage of debt to revenue ratio is lower for major U.S. states than Portugal, Italy and Greece.
- The percentage of debt to GDP is lower for certain major U.S. states than Spain, Ireland, Portugal, Greece and Italy.


- The most recent example of our states enjoying a favorable GDP and Debt to GDP and Debt to Revenue Ratios compared to other Sovereigns on a global basis is China.
- China has:
- 31 provinces and regional governments.
- 391 cities.
- 2,778 counties.
- 33,000 townships.
- The combined debt of these local governments is approximately $3 trillion or 36% of China’s GDP (2012) (China National Audit Office).
- 99 cities, 195 counties and 3,465 townships in China had direct debt 2013 exceeding 100% of their respective annual economic output (GDP).
- The USA has:
- 50 states.
- 3,031 counties.
- 19,522 municipalities.
- 16,364 townships.
- 37,203 special districts.
- 12,884 independent school districts.
- The combined debt of state and local governments is approximately $3 trillion (Federal Reserve Bank of St. Louis 2013) or 18.52% of the USA’s GDP.
- The highest debt to GDP for any state and its local government is approximately 26% New York with the lowest being Wyoming at 5.25%. The percentage of debt to local GDP for large city issuers in the USA is generally less than 20% and in most instances less than 10%.
- China has:

James E. Spiotto, Co-Publisher © James E. Spiotto. All rights reserved (2015).